
Introduction
Kibana 4 is an analytics and visualization platform that builds on Elasticsearch to give you a better understanding of your data. In this tutorial, we will get you started with Kibana, by showing you how to use its interface to filter and visualize log messages gathered by an Elasticsearch ELK stack. We will cover the main interface components, and demonstrate how to create searches, visualizations, and dashboards.
Prerequisites
This tutorial is the third part in the Centralized Logging with Logstash and Kibana series.
It assumes that you have a working ELK setup. The examples assume that you are gathering syslog and Nginx access logs. If you are not gathering these types of logs, you should be able to modify the demonstrations to work with your own log messages.
If you want to follow this tutorial exactly as presented, you should have the following setup, by following the first two tutorials in this series:
- An ELK Stack gathering syslogs: How To Install Elasticsearch, Logstash, and Kibana 4 on Ubuntu 14.04
- Nginx access logs and filters: Adding Logstash Filters To Improve Centralized Logging
When you are ready to move on, let’s look at an overview of the Kibana interface.
Kibana Interface Overview
The Kibana interface is divided into four main sections:
- Discover
- Visualize
- Dashboard
- Settings
We will go over the basics of each section, in the listed order, and demonstrate how each piece of the interface can be used.
Kibana Discover
When you first connect to Kibana 4, you will be taken to the Discover page. By default, this page will display all of your ELK stack’s most recently received logs. Here, you can filter through and find specific log messages based on Search Queries, then narrow the search results to a specific time range with the Time Filter.
Here is a breakdown of the Kibana Discover interface elements:
- Search Bar: Directly under the main navigation menu. Use this to search specific fields and/or entire messages
- Time Filter: Top-right (clock icon). Use this to filter logs based on various relative and absolute time ranges
- Field Selector: Left, under the search bar. Select fields to modify which ones are displayed in the Log View
- Date Histogram: Bar graph under the search bar. By default, this shows the count of all logs, versus time (x-axis), matched by the search and time filter. You can click on bars, or click-and-drag, to narrow the time filter
- Log View: Bottom-right. Use this to look at individual log messages, and display log data filtered by fields. If no fields are selected, entire log messages are displayed
This animation demonstrates a few of the main features of the Discover page:
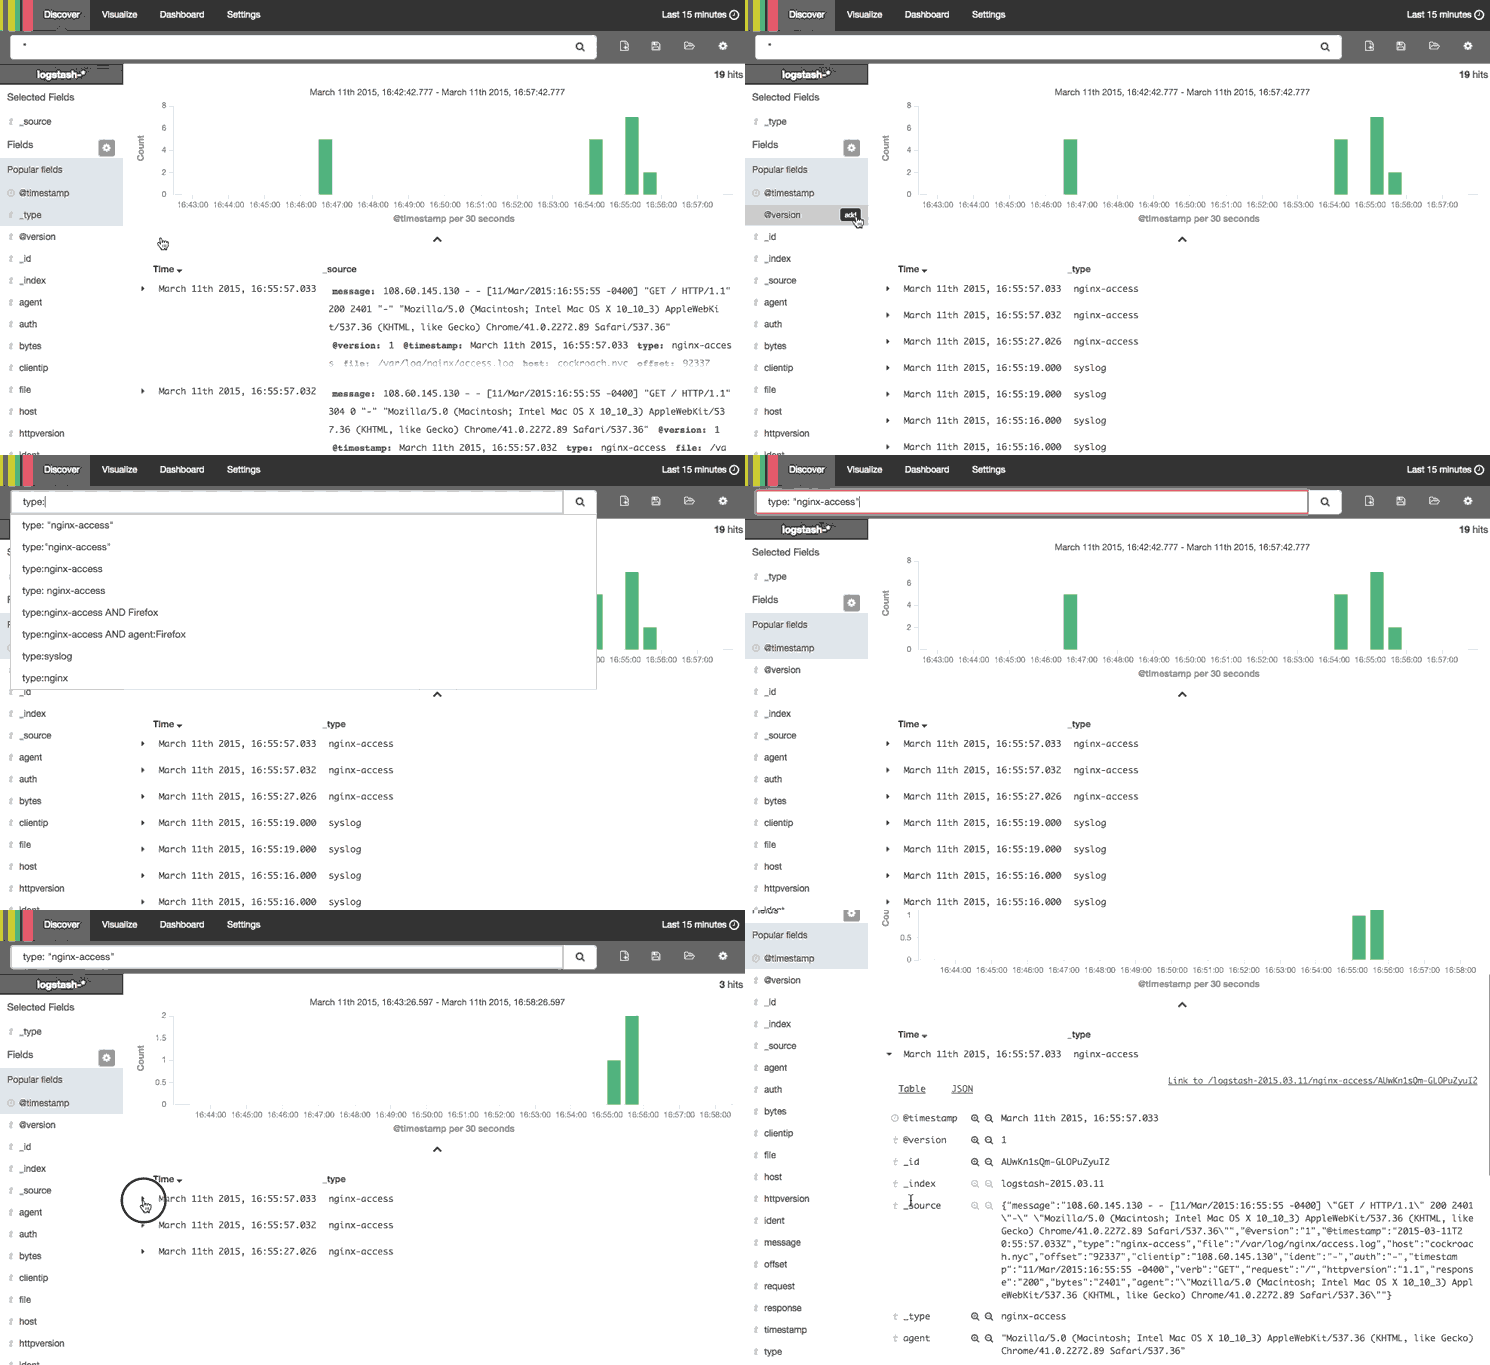
Here is a step-by-step description of what is being performed:
- Selected the “type” field, which limits what is displayed for each log record (bottom-right)—by default, the entire log message is displayed
- Searched for
type: "nginx-access", which only matches Nginx access logs - Expanded the most recent Nginx access log to look at it in more detail
Note that the results are being limited to the “Last 15 minutes”. If you are not getting any results, be sure that there were logs, that match your search query, generated in the time period specified.
The log messages that are gathered and filtered are dependent on your Logstash and Logstash Forwarder configurations. In our example, we are gathering the syslog and Nginx access logs, and filtering them by “type”. If you are gathering log messages but not filtering the data into distinct fields, querying against them will be more difficult as you will be unable to query specific fields.
Search Syntax
The search provides an easy and powerful way to select a specific subset of log messages. The search syntax is pretty self-explanatory, and allows boolean operators, wildcards, and field filtering. For example, if you want to find Nginx access logs that were generated by Google Chrome users, you can search for type: "nginx-access" AND agent: "chrome". You could also search by specific hosts or client IP address ranges, or any other data that is contained in your logs.
When you have created a search query that you want to keep, you can do that by clicking the Save Search icon then the Save button, like in this animation:
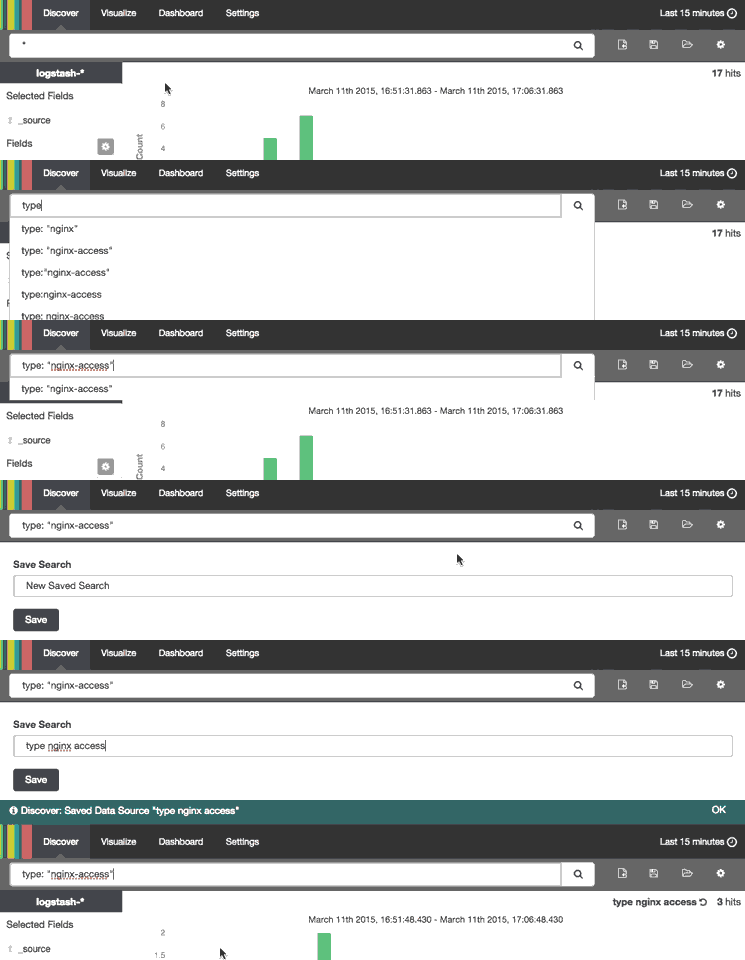
Saved searches can be opened at any time by clicking the Load Saved Search icon, and they can also be used when creating visualizations.
We will save the type: "nginx-access" search as “type nginx access”, and use it to create a visualization.
Kibana Visualize
The Kibana Visualize page is where you can create, modify, and view your own custom visualizations. There are several different types of visualizations, ranging from Vertical bar and Pie charts to Tile maps (for displaying data on a map) and Data tables. Visualizations can also be shared with other users who have access to your Kibana instance.
If this is your first time using Kibana visualizations, you must reload your field list before proceeding. Instructions to do this are covered in the Reload Field Data subsection, under the Kibana Settings section.
Create Vertical Bar Chart
To create a visualization, first, click the Visualize menu item.
Decide which type of visualization you want, and select it. We will create a Vertical bar chart, which is a good starting point.
Now you must select a search source. You may either create a new search or use a saved search. We will go with the latter method, and select the type nginx access search that we created earlier.
At first, the preview graph, on the right side, will be a solid bar (assuming that your search found log messages) because it consists only of a Y-axis of “Count”. That is, it is simply displaying the number of logs that were found with the specified search query.
To make the visualization more useful, let’s add some new buckets to it.
First, add an X-axis bucket, then click the Aggregation drop-down menu and select “Date Histogram”. If you click the Apply button, the single bar will split into several bars along the X-axis. Now the Count is displayed as multiple bars, divided into intervals of time (which can be modified by selecting an interval from the drop-down)—similar to what you would see on the Discover page.
If we want to make the graph a little more interesting, we can click the Add Sub Aggregation button. Select the Split Bars bucket type. Click the Sub Aggregation drop-down menu and select “Significant Terms”, then click the Field drop-down menu and select “clientip.raw”, then click the Size field and enter “10”. Click the Apply button to create the new graph.
Here is a screenshot of what you should see at this point:
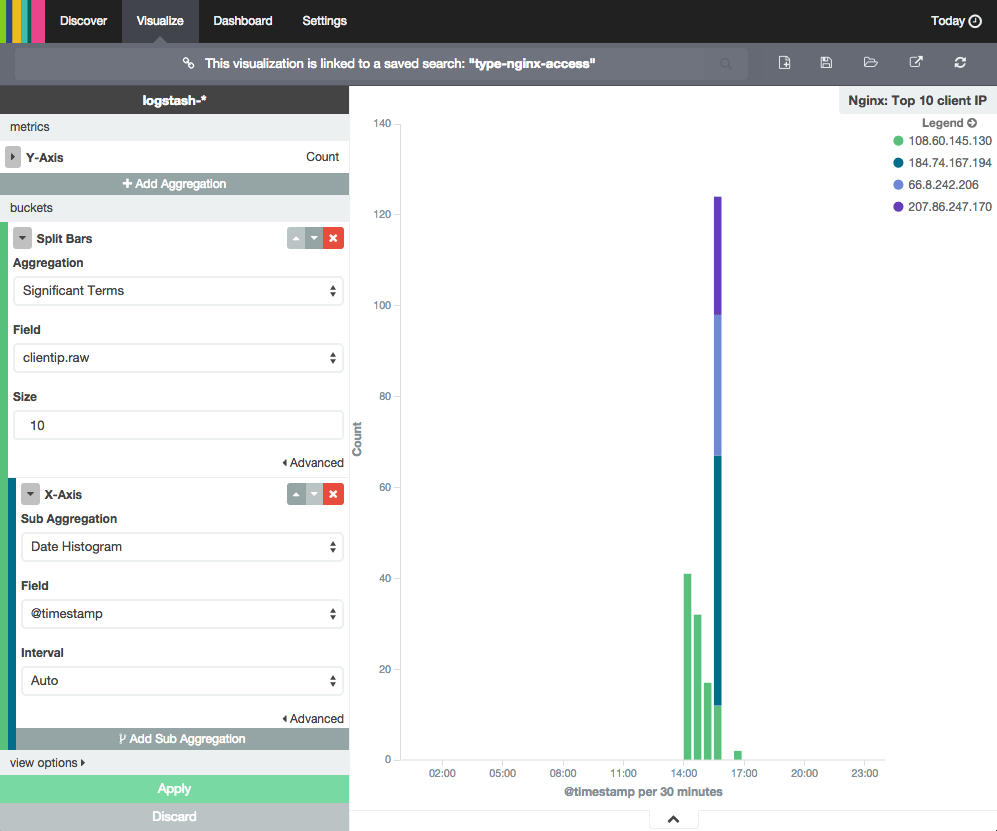
If the logs being visualized were generated by multiple IP addresses (i.e. more than one person is accessing your site), you will see that each bar will be divided into colored segments. Each colored segment represents the Count of logs generated by a specific IP address (i.e. a particular visitor to your site), and the graph will show the up to 10 different segments (because of the Size setting). You can mouseover and click any of the items in the graph to drill down to specific log messages.
When you are ready to save your visualization, click the Save Visualization icon, near the top, then name it and click the Save button.
Create Another Visualization
Before continuing to the next section, where we will demonstrate how to create a dashboard, you should create at least one more visualization. Try and explore the various visualization types.
For example, you could create a pie chart of your top 5 (highest count) log “types”. To do this, click Visualize then select Pie chart. Then use a new search, and leave the search as “*” (i.e. all of your logs). Then select Split Slices bucket. Click the Aggregation drop-down and select “Significant Terms”, click the Field drop-down and select “type.raw”, then click the Size field and enter “5”. Now click the Apply button and save the visualization as “Top 5”.
Here is a screenshot of the settings that were just described:
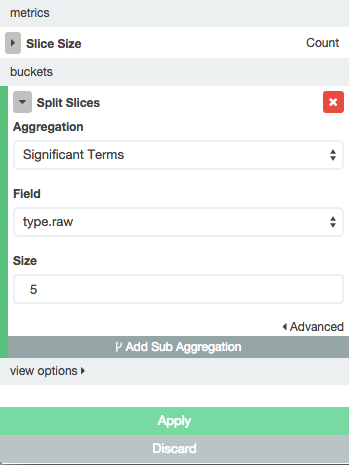
Because, in our example, we’re only collecting syslogs and Nginx access logs, there will only be two slices in the pie chart.
Once you are done creating visualizations, let’s move on to creating a Kibana dashboard.
Kibana Dashboard
The Kibana Dashboard page is where you can create, modify, and view your own custom dashboards. With a dashboard, you can combine multiple visualizations onto a single page, then filter them by providing a search query or by selecting filters by clicking elements in the visualization. Dashboards are useful for when you want to get an overview of your logs, and make correlations among various visualizations and logs.
Create Dashboard
To create a Kibana dashboard, first, click the Dashboard menu item.
If you haven’t created a dashboard before, you will see a mostly blank page that says “Ready to get started?”. If you don’t see this screen (i.e. there are already visualizations on the dashboard), press the New Dashboard icon (to the right of the search bar) to get there.
This animation demonstrates how to can add visualizations to your dashboard:
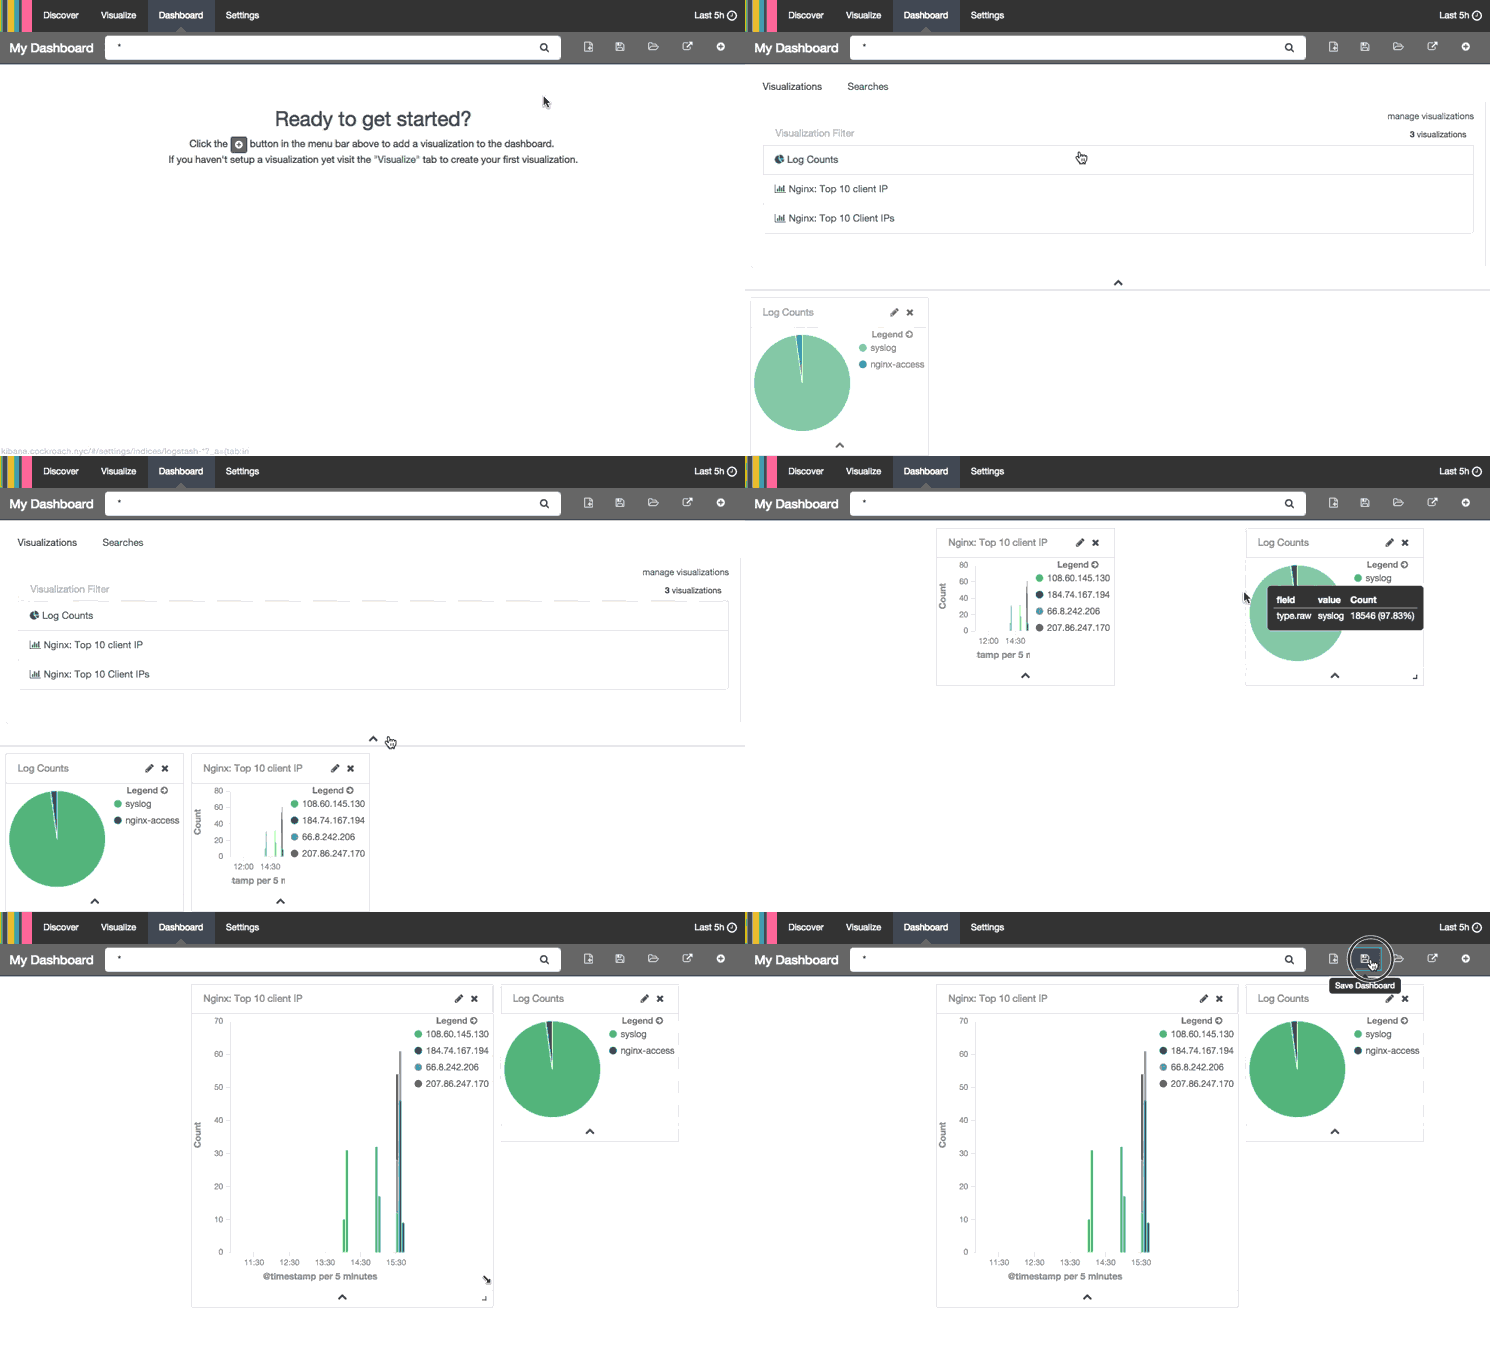
Here is a breakdown of the steps that are being performed:
- Clicked Add Visualization icon
- Added “Log Counts” pie chart and “Nginx: Top 10 client IP” histogram
- Collapsed the Add Visualization menu
- Rearranged and resized the visualizations on the dashboard
- Clicked Save Dashboard icon
Choose a name for your dashboard before saving it.
This should give you a good idea of how to create a dashboard. Go ahead and create any dashboards that you think you might want. We’ll cover using dashboards next.
Use Dashboard
Dashboards can be filtered further by entering a search query, changing the time filter, or clicking on the elements within the visualization.
For example, if you click on a particular color segment in the histogram, Kibana will allow you to filter on the significant term that the segment represents. Here is an example screenshot of applying a filter to a dashboard:
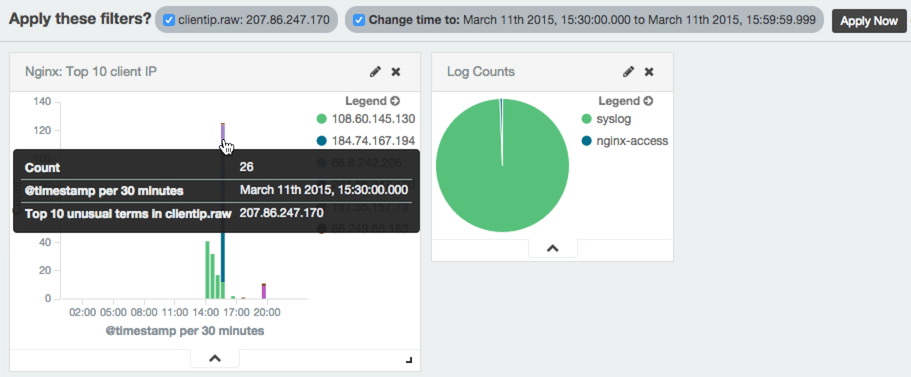
Be sure to click the Apply Now button to filter the results, and redraw the dashboard’s visualizations. Filters can be applied and removed as needed.
The search and time filters work just like they do in the Discover page, except they are only applied to the data subsets that are presented in the dashboard.
Kibana Settings
The Kibana Settings page lets you change a variety of things like default values or index patterns. In this tutorial, we will keep it simple and focus on the Indices and Objects sections.
Reload Field Data
When you add new fields to your Logstash data, e.g. if you add a filter for a new log type, you may need to reload your field list. It is necessary to reload the field list if you are unable find filtered fields in Kibana, as this data is only cached periodically.
To do so, click the Settings menu item, then click “logstash-*” (under Index Patterns):

Then click the yellow Reload Field List button. Hit the OK button to confirm.
Edit Saved Objects
The Objects section allows you to edit, view, and delete any of your saved dashboards, searches, and visualizations.
To get there, click on the Settings menu item, then the Objects sub-menu.
Here, you can select from the tabs to find the objects that you want to edit, view, or delete:
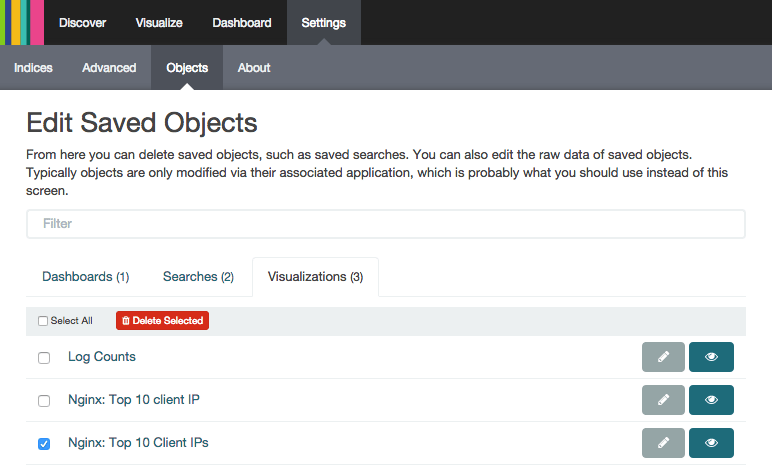
In the screenshot, we have selected a duplicate visualization. It can be edited, viewed, or deleted by clicking on the appropriate button.
Conclusion
If you followed this tutorial, you should have a good understanding of how to use Kibana 4. You should know how to search your log messages, and create visualizations and dashboards.
Be sure to check out the next tutorial in this series, How To Map User Location with GeoIP and ELK
If you have any questions or suggestions, please leave a comment!
Thanks for learning with the DigitalOcean Community. Check out our offerings for compute, storage, networking, and managed databases.
Tutorial Series: Centralized Logging with ELK Stack (Elasticsearch, Logstash, and Kibana) On Ubuntu 14.04
Centralized logging can be very useful when attempting to identify problems with your servers or applications, as it allows you to search through all of your logs in a single place. It is also useful because it allows you to identify issues that span multiple servers by correlating their logs during a specific time frame.
This series will teach you how to install Logstash and Kibana on Ubuntu, then how to add more filters to structure your log data. Then it will teach you how to use Kibana.
Tutorial Series: Centralized Logging with Logstash and Kibana On CentOS 7
Centralized logging can be very useful when attempting to identify problems with your servers or applications, as it allows you to search through all of your logs in a single place. It is also useful because it allows you to identify issues that span multiple servers by correlating their logs during a specific time frame. This series will teach you how to install Logstash and Kibana on Ubuntu, then how to add more filters to structure your log data. Then it will teach you how to use Kibana.
About the author

Software Engineer @ DigitalOcean. Former Señor Technical Writer (I no longer update articles or respond to comments). Expertise in areas including Ubuntu, PostgreSQL, MySQL, and more.
Still looking for an answer?
 This work is licensed under a Creative Commons Attribution-NonCommercial- ShareAlike 4.0 International License.
Become a contributor for community
Get paid to write technical tutorials and select a tech-focused charity to receive a matching donation.
DigitalOcean Documentation
Full documentation for every DigitalOcean product.
Resources for startups and AI-native businesses
The Wave has everything you need to know about building a business, from raising funding to marketing your product.
The developer cloud
Scale up as you grow — whether you're running one virtual machine or ten thousand.

Start building today
From GPU-powered inference and Kubernetes to managed databases and storage, get everything you need to build, scale, and deploy intelligent applications.