
Introduction
In this tutorial, we will go over the installation of the Elasticsearch ELK Stack on CentOS 7—that is, Elasticsearch 2.2.x, Logstash 2.2.x, and Kibana 4.4.x. We will also show you how to configure it to gather and visualize the syslogs of your systems in a centralized location, using Filebeat 1.1.x. Logstash is an open source tool for collecting, parsing, and storing logs for future use. Kibana is a web interface that can be used to search and view the logs that Logstash has indexed. Both of these tools are based on Elasticsearch, which is used for storing logs.
Centralized logging can be very useful when attempting to identify problems with your servers or applications, as it allows you to search through all of your logs in a single place. It is also useful because it allows you to identify issues that span multiple servers by correlating their logs during a specific time frame.
It is possible to use Logstash to gather logs of all types, but we will limit the scope of this tutorial to syslog gathering.
Our Goal
The goal of the tutorial is to set up Logstash to gather syslogs of multiple servers, and set up Kibana to visualize the gathered logs.
Our ELK stack setup has four main components:
- Logstash: The server component of Logstash that processes incoming logs
- Elasticsearch: Stores all of the logs
- Kibana: Web interface for searching and visualizing logs, which will be proxied through Nginx
- Filebeat: Installed on client servers that will send their logs to Logstash, Filebeat serves as a log shipping agent that utilizes the lumberjack networking protocol to communicate with Logstash
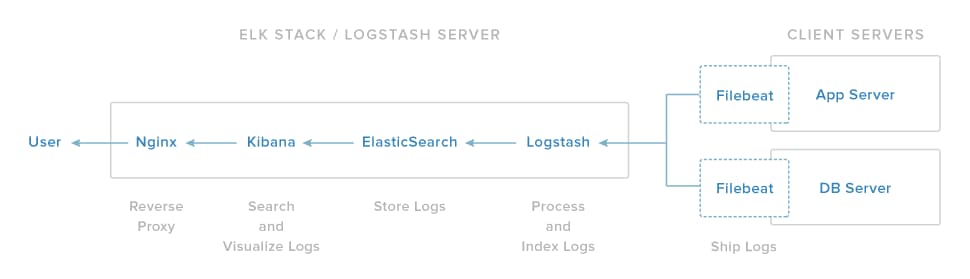
We will install the first three components on a single server, which we will refer to as our ELK Server. Filebeat will be installed on all of the client servers that we want to gather logs for, which we will refer to collectively as our Client Servers.
Prerequisites
To complete this tutorial, you will require root access to an CentOS 7 VPS. Instructions to set that up can be found here (steps 3 and 4): Initial Server Setup with CentOS 7.
If you would prefer to use Ubuntu instead, check out this tutorial: How To Install ELK on Ubuntu 14.04.
The amount of CPU, RAM, and storage that your ELK Server will require depends on the volume of logs that you intend to gather. For this tutorial, we will be using a VPS with the following specs for our ELK Server:
- OS: CentOS 7
- RAM: 4GB
- CPU: 2
In addition to your ELK Server, you will want to have a few other servers that you will gather logs from.
Let’s get started on setting up our ELK Server!
Install Java 8
Elasticsearch and Logstash require Java, so we will install that now. We will install a recent version of Oracle Java 8 because that is what Elasticsearch recommends. It should, however, work fine with OpenJDK, if you decide to go that route. Following the steps in this section means that you accept the Oracle Binary License Agreement for Java SE.
Change to your home directory and download the Oracle Java 8 (Update 73, the latest at the time of this writing) JDK RPM with these commands:
- cd ~
- wget --no-cookies --no-check-certificate --header "Cookie: gpw_e24=http%3A%2F%2Fwww.oracle.com%2F; oraclelicense=accept-securebackup-cookie" "http://download.oracle.com/otn-pub/java/jdk/8u73-b02/jdk-8u73-linux-x64.rpm"
Then install the RPM with this yum command (if you downloaded a different release, substitute the filename here):
- sudo yum -y localinstall jdk-8u73-linux-x64.rpm
Now Java should be installed at /usr/java/jdk1.8.0_73/jre/bin/java, and linked from /usr/bin/java.
You may delete the archive file that you downloaded earlier:
- rm ~/jdk-8u*-linux-x64.rpm
Now that Java 8 is installed, let’s install ElasticSearch.
Install Elasticsearch
Elasticsearch can be installed with a package manager by adding Elastic’s package repository.
Run the following command to import the Elasticsearch public GPG key into rpm:
- sudo rpm --import http://packages.elastic.co/GPG-KEY-elasticsearch
Create a new yum repository file for Elasticsearch. Note that this is a single command:
- echo '[elasticsearch-2.x]
- name=Elasticsearch repository for 2.x packages
- baseurl=http://packages.elastic.co/elasticsearch/2.x/centos
- gpgcheck=1
- gpgkey=http://packages.elastic.co/GPG-KEY-elasticsearch
- enabled=1
- ' | sudo tee /etc/yum.repos.d/elasticsearch.repo
Install Elasticsearch with this command:
- sudo yum -y install elasticsearch
Elasticsearch is now installed. Let’s edit the configuration:
- sudo vi /etc/elasticsearch/elasticsearch.yml
You will want to restrict outside access to your Elasticsearch instance (port 9200), so outsiders can’t read your data or shutdown your Elasticsearch cluster through the HTTP API. Find the line that specifies network.host, uncomment it, and replace its value with “localhost” so it looks like this:
network.host: localhost
Save and exit elasticsearch.yml.
Now start Elasticsearch:
- sudo systemctl start elasticsearch
Then run the following command to start Elasticsearch automatically on boot up:
- sudo systemctl enable elasticsearch
Now that Elasticsearch is up and running, let’s install Kibana.
Install Kibana
The Kibana package shares the same GPG Key as Elasticsearch, and we already installed that public key.
Create and edit a new yum repository file for Kibana:
- sudo vi /etc/yum.repos.d/kibana.repo
Add the following repository configuration:
- [kibana-4.4]
- name=Kibana repository for 4.4.x packages
- baseurl=http://packages.elastic.co/kibana/4.4/centos
- gpgcheck=1
- gpgkey=http://packages.elastic.co/GPG-KEY-elasticsearch
- enabled=1
Save and exit.
Install Kibana with this command:
- sudo yum -y install kibana
Open the Kibana configuration file for editing:
- sudo vi /opt/kibana/config/kibana.yml
In the Kibana configuration file, find the line that specifies server.host, and replace the IP address (“0.0.0.0” by default) with “localhost”:
server.host: "localhost"
Save and exit. This setting makes it so Kibana will only be accessible to the localhost. This is fine because we will install an Nginx reverse proxy, on the same server, to allow external access.
Now start the Kibana service, and enable it:
- sudo systemctl start kibana
- sudo chkconfig kibana on
Before we can use the Kibana web interface, we have to set up a reverse proxy. Let’s do that now, with Nginx.
Install Nginx
Because we configured Kibana to listen on localhost, we must set up a reverse proxy to allow external access to it. We will use Nginx for this purpose.
Note: If you already have an Nginx instance that you want to use, feel free to use that instead. Just make sure to configure Kibana so it is reachable by your Nginx server (you probably want to change the host value, in /opt/kibana/config/kibana.yml, to your Kibana server’s private IP address). Also, it is recommended that you enable SSL/TLS.
Add the EPEL repository to yum:
- sudo yum -y install epel-release
Now use yum to install Nginx and httpd-tools:
- sudo yum -y install nginx httpd-tools
Use htpasswd to create an admin user, called “kibanaadmin” (you should use another name), that can access the Kibana web interface:
- sudo htpasswd -c /etc/nginx/htpasswd.users kibanaadmin
Enter a password at the prompt. Remember this login, as you will need it to access the Kibana web interface.
Now open the Nginx configuration file in your favorite editor. We will use vi:
- sudo vi /etc/nginx/nginx.conf
Find the default server block (starts with server {), the last configuration block in the file, and delete it. When you are done, the last two lines in the file should look like this:
    include /etc/nginx/conf.d/*.conf;
}
Save and exit.
Now we will create an Nginx server block in a new file:
- sudo vi /etc/nginx/conf.d/kibana.conf
Paste the following code block into the file. Be sure to update the server_name to match your server’s name:
- server {
- listen 80;
-
- server_name example.com;
-
- auth_basic "Restricted Access";
- auth_basic_user_file /etc/nginx/htpasswd.users;
-
- location / {
- proxy_pass http://localhost:5601;
- proxy_http_version 1.1;
- proxy_set_header Upgrade $http_upgrade;
- proxy_set_header Connection 'upgrade';
- proxy_set_header Host $host;
- proxy_cache_bypass $http_upgrade;
- }
- }
Save and exit. This configures Nginx to direct your server’s HTTP traffic to the Kibana application, which is listening on localhost:5601. Also, Nginx will use the htpasswd.users file, that we created earlier, and require basic authentication.
Now start and enable Nginx to put our changes into effect:
- sudo systemctl start nginx
- sudo systemctl enable nginx
Note: This tutorial assumes that SELinux is disabled. If this is not the case, you may need to run the following command for Kibana to work properly: sudo setsebool -P httpd_can_network_connect 1
Kibana is now accessible via your FQDN or the public IP address of your ELK Server i.e. http://elk_server_public_ip/. If you go there in a web browser, after entering the “kibanaadmin” credentials, you should see a Kibana welcome page which will ask you to configure an index pattern. Let’s get back to that later, after we install all of the other components.
Install Logstash
The Logstash package shares the same GPG Key as Elasticsearch, and we already installed that public key, so let’s create and edit a new Yum repository file for Logstash:
- sudo vi /etc/yum.repos.d/logstash.repo
Add the following repository configuration:
- [logstash-2.2]
- name=logstash repository for 2.2 packages
- baseurl=http://packages.elasticsearch.org/logstash/2.2/centos
- gpgcheck=1
- gpgkey=http://packages.elasticsearch.org/GPG-KEY-elasticsearch
- enabled=1
Save and exit.
Install Logstash with this command:
- sudo yum -y install logstash
Logstash is installed but it is not configured yet.
Generate SSL Certificates
Since we are going to use Filebeat to ship logs from our Client Servers to our ELK Server, we need to create an SSL certificate and key pair. The certificate is used by Filebeat to verify the identity of ELK Server. Create the directories that will store the certificate and private key with the following commands:
Now you have two options for generating your SSL certificates. If you have a DNS setup that will allow your client servers to resolve the IP address of the ELK Server, use Option 2. Otherwise, Option 1 will allow you to use IP addresses.
Option 1: IP Address
If you don’t have a DNS setup—that would allow your servers, that you will gather logs from, to resolve the IP address of your ELK Server—you will have to add your ELK Server’s private IP address to the subjectAltName (SAN) field of the SSL certificate that we are about to generate. To do so, open the OpenSSL configuration file:
- sudo vi /etc/pki/tls/openssl.cnf
Find the [ v3_ca ] section in the file, and add this line under it (substituting in the ELK Server’s private IP address):
- subjectAltName = IP: ELK_server_private_ip
Save and exit.
Now generate the SSL certificate and private key in the appropriate locations (/etc/pki/tls/), with the following commands:
- cd /etc/pki/tls
- sudo openssl req -config /etc/pki/tls/openssl.cnf -x509 -days 3650 -batch -nodes -newkey rsa:2048 -keyout private/logstash-forwarder.key -out certs/logstash-forwarder.crt
The logstash-forwarder.crt file will be copied to all of the servers that will send logs to Logstash but we will do that a little later. Let’s complete our Logstash configuration. If you went with this option, skip option 2 and move on to Configure Logstash.
Option 2: FQDN (DNS)
If you have a DNS setup with your private networking, you should create an A record that contains the ELK Server’s private IP address—this domain name will be used in the next command, to generate the SSL certificate. Alternatively, you can use a record that points to the server’s public IP address. Just be sure that your servers (the ones that you will be gathering logs from) will be able to resolve the domain name to your ELK Server.
Now generate the SSL certificate and private key, in the appropriate locations (/etc/pki/tls/…), with the following command (substitute in the FQDN of the ELK Server):
- cd /etc/pki/tls
- sudo openssl req -subj '/CN=ELK_server_fqdn/' -x509 -days 3650 -batch -nodes -newkey rsa:2048 -keyout private/logstash-forwarder.key -out certs/logstash-forwarder.crt
The logstash-forwarder.crt file will be copied to all of the servers that will send logs to Logstash but we will do that a little later. Let’s complete our Logstash configuration.
Configure Logstash
Logstash configuration files are in the JSON-format, and reside in /etc/logstash/conf.d. The configuration consists of three sections: inputs, filters, and outputs.
Let’s create a configuration file called 02-beats-input.conf and set up our “filebeat” input:
- sudo vi /etc/logstash/conf.d/02-beats-input.conf
Insert the following input configuration:
- input {
- beats {
- port => 5044
- ssl => true
- ssl_certificate => "/etc/pki/tls/certs/logstash-forwarder.crt"
- ssl_key => "/etc/pki/tls/private/logstash-forwarder.key"
- }
- }
Save and quit. This specifies a beats input that will listen on tcp port 5044, and it will use the SSL certificate and private key that we created earlier.
Now let’s create a configuration file called 10-syslog-filter.conf, where we will add a filter for syslog messages:
- sudo vi /etc/logstash/conf.d/10-syslog-filter.conf
Insert the following syslog filter configuration:
- filter {
- if [type] == "syslog" {
- grok {
- match => { "message" => "%{SYSLOGTIMESTAMP:syslog_timestamp} %{SYSLOGHOST:syslog_hostname} %{DATA:syslog_program}(?:\[%{POSINT:syslog_pid}\])?: %{GREEDYDATA:syslog_message}" }
- add_field => [ "received_at", "%{@timestamp}" ]
- add_field => [ "received_from", "%{host}" ]
- }
- syslog_pri { }
- date {
- match => [ "syslog_timestamp", "MMM d HH:mm:ss", "MMM dd HH:mm:ss" ]
- }
- }
- }
Save and quit. This filter looks for logs that are labeled as “syslog” type (by Filebeat), and it will try to use grok to parse incoming syslog logs to make it structured and query-able.
Lastly, we will create a configuration file called 30-elasticsearch-output.conf:
- sudo vi /etc/logstash/conf.d/30-elasticsearch-output.conf
Insert the following output configuration:
- output {
- elasticsearch {
- hosts => ["localhost:9200"]
- sniffing => true
- manage_template => false
- index => "%{[@metadata][beat]}-%{+YYYY.MM.dd}"
- document_type => "%{[@metadata][type]}"
- }
- }
Save and exit. This output basically configures Logstash to store the beats data in Elasticsearch which is running at localhost:9200, in an index named after the beat used (filebeat, in our case).
If you want to add filters for other applications that use the Filebeat input, be sure to name the files so they sort between the input and the output configuration (i.e. between 02- and 30-).
Test your Logstash configuration with this command:
- sudo service logstash configtest
It should display Configuration OK if there are no syntax errors. Otherwise, try and read the error output to see what’s wrong with your Logstash configuration.
Restart and enable Logstash to put our configuration changes into effect:
- sudo systemctl restart logstash
- sudo chkconfig logstash on
Next, we’ll load the sample Kibana dashboards.
Load Kibana Dashboards
Elastic provides several sample Kibana dashboards and Beats index patterns that can help you get started with Kibana. Although we won’t use the dashboards in this tutorial, we’ll load them anyway so we can use the Filebeat index pattern that it includes.
First, download the sample dashboards archive to your home directory:
- cd ~
- curl -L -O https://download.elastic.co/beats/dashboards/beats-dashboards-1.1.0.zip
Install the unzip package with this command:
- sudo yum -y install unzip
Next, extract the contents of the archive:
- unzip beats-dashboards-*.zip
And load the sample dashboards, visualizations and Beats index patterns into Elasticsearch with these commands:
- cd beats-dashboards-*
- ./load.sh
These are the index patterns that we just loaded:
- [packetbeat-]YYYY.MM.DD
- [topbeat-]YYYY.MM.DD
- [filebeat-]YYYY.MM.DD
- [winlogbeat-]YYYY.MM.DD
When we start using Kibana, we will select the Filebeat index pattern as our default.
Load Filebeat Index Template in Elasticsearch
Because we are planning on using Filebeat to ship logs to Elasticsearch, we should load a Filebeat index template. The index template will configure Elasticsearch to analyze incoming Filebeat fields in an intelligent way.
First, download the Filebeat index template to your home directory:
- cd ~
- curl -O https://gist.githubusercontent.com/thisismitch/3429023e8438cc25b86c/raw/d8c479e2a1adcea8b1fe86570e42abab0f10f364/filebeat-index-template.json
Then load the template with this command:
- curl -XPUT 'http://localhost:9200/_template/filebeat?pretty' -d@filebeat-index-template.json
If the template loaded properly, you should see a message like this:
Output:{
  "acknowledged" : true
}
Now that our ELK Server is ready to receive Filebeat data, let’s move onto setting up Filebeat on each client server.
Set Up Filebeat (Add Client Servers)
Do these steps for each CentOS or RHEL 7 server that you want to send logs to your ELK Server. For instructions on installing Filebeat on Debian-based Linux distributions (e.g. Ubuntu, Debian, etc.), refer to the Set Up Filebeat (Add Client Servers) section of the Ubuntu variation of this tutorial.
Copy SSL Certificate
On your ELK Server, copy the SSL certificate—created in the prerequisite tutorial—to your Client Server (substitute the client server’s address, and your own login):
- scp /etc/pki/tls/certs/logstash-forwarder.crt user@client_server_private_address:/tmp
After providing your login’s credentials, ensure that the certificate copy was successful. It is required for communication between the client servers and the ELK Server.
Now, on your Client Server, copy the ELK Server’s SSL certificate into the appropriate location (/etc/pki/tls/certs):
- sudo mkdir -p /etc/pki/tls/certs
- sudo cp /tmp/logstash-forwarder.crt /etc/pki/tls/certs/
Now we will install the Topbeat package.
Install Filebeat Package
On Client Server, create run the following command to import the Elasticsearch public GPG key into rpm:
- sudo rpm --import http://packages.elastic.co/GPG-KEY-elasticsearch
Create and edit a new yum repository file for Filebeat:
- sudo vi /etc/yum.repos.d/elastic-beats.repo
Add the following repository configuration:
- [beats]
- name=Elastic Beats Repository
- baseurl=https://packages.elastic.co/beats/yum/el/$basearch
- enabled=1
- gpgkey=https://packages.elastic.co/GPG-KEY-elasticsearch
- gpgcheck=1
Save and exit.
Install Filebeat with this command:
- sudo yum -y install filebeat
Filebeat is installed but it is not configured yet.
Configure Filebeat
Now we will configure Filebeat to connect to Logstash on our ELK Server. This section will step you through modifying the example configuration file that comes with Filebeat. When you complete the steps, you should have a file that looks something like this.
On Client Server, create and edit Filebeat configuration file:
- sudo vi /etc/filebeat/filebeat.yml
Note: Filebeat’s configuration file is in YAML format, which means that indentation is very important! Be sure to use the same number of spaces that are indicated in these instructions.
Near the top of the file, you will see the prospectors section, which is where you can define prospectors that specify which log files should be shipped and how they should be handled. Each prospector is indicated by the - character.
We’ll modify the existing prospector to send secure and messages logs to Logstash. Under paths, comment out the - /var/log/*.log file. This will prevent Filebeat from sending every .log in that directory to Logstash. Then add new entries for syslog and auth.log. It should look something like this when you’re done:
...
      paths:
        - /var/log/secure
        - /var/log/messages
#        - /var/log/*.log
...
Then find the line that specifies document_type:, uncomment it and change its value to “syslog”. It should look like this after the modification:
...
      document_type: syslog
...
This specifies that the logs in this prospector are of type syslog (which is the type that our Logstash filter is looking for).
If you want to send other files to your ELK server, or make any changes to how Filebeat handles your logs, feel free to modify or add prospector entries.
Next, under the output section, find the line that says elasticsearch:, which indicates the Elasticsearch output section (which we are not going to use). Delete or comment out the entire Elasticsearch output section (up to the line that says logstash:).
Find the commented out Logstash output section, indicated by the line that says #logstash:, and uncomment it by deleting the preceding #. In this section, uncomment the hosts: ["localhost:5044"] line. Change localhost to the private IP address (or hostname, if you went with that option) of your ELK server:
  ### Logstash as output
  logstash:
    # The Logstash hosts
    hosts: ["ELK_server_private_IP:5044"]
This configures Filebeat to connect to Logstash on your ELK Server at port 5044 (the port that we specified an input for earlier).
Directly under the hosts entry, and with the same indentation, add this line:
bulk_max_size: 1024
Next, find the tls section, and uncomment it. Then uncomment the line that specifies certificate_authorities, and change its value to ["/etc/pki/tls/certs/logstash-forwarder.crt"]. It should look something like this:
...
    tls:
      # List of root certificates for HTTPS server verifications
      certificate_authorities: ["/etc/pki/tls/certs/logstash-forwarder.crt"]
This configures Filebeat to use the SSL certificate that we created on the ELK Server.
Save and quit.
Now start and enable Filebeat to put our changes into place:
- sudo systemctl start filebeat
- sudo systemctl enable filebeat
Again, if you’re not sure if your Filebeat configuration is correct, compare it against this example Filebeat configuration.
Now Filebeat is sending your syslog messages and secure files to your ELK Server! Repeat this section for all of the other servers that you wish to gather logs for.
Test Filebeat Installation
If your ELK stack is setup properly, Filebeat (on your client server) should be shipping your logs to Logstash on your ELK server. Logstash should be loading the Filebeat data into Elasticsearch in an date-stamped index, filebeat-YYYY.MM.DD.
On your ELK Server, verify that Elasticsearch is indeed receiving the data by querying for the Filebeat index with this command:
- curl -XGET 'http://localhost:9200/filebeat-*/_search?pretty'
You should see a bunch of output that looks like this:
Sample Output:...
{
      "_index" : "filebeat-2016.01.29",
      "_type" : "log",
      "_id" : "AVKO98yuaHvsHQLa53HE",
      "_score" : 1.0,
      "_source":{"message":"Feb  3 14:34:00 rails sshd[963]: Server listening on :: port 22.","@version":"1","@timestamp":"2016-01-29T19:59:09.145Z","beat":{"hostname":"topbeat-u-03","name":"topbeat-u-03"},"count":1,"fields":null,"input_type":"log","offset":70,"source":"/var/log/auth.log","type":"log","host":"topbeat-u-03"}
    }
...
If your output shows 0 total hits, Elasticsearch is not loading any logs under the index you searched for, and you should review your setup for errors. If you received the expected output, continue to the next step.
Connect to Kibana
When you are finished setting up Filebeat on all of the servers that you want to gather logs for, let’s look at Kibana, the web interface that we installed earlier.
In a web browser, go to the FQDN or public IP address of your ELK Server. After entering the “kibanaadmin” credentials, you should see a page prompting you to configure a default index pattern:
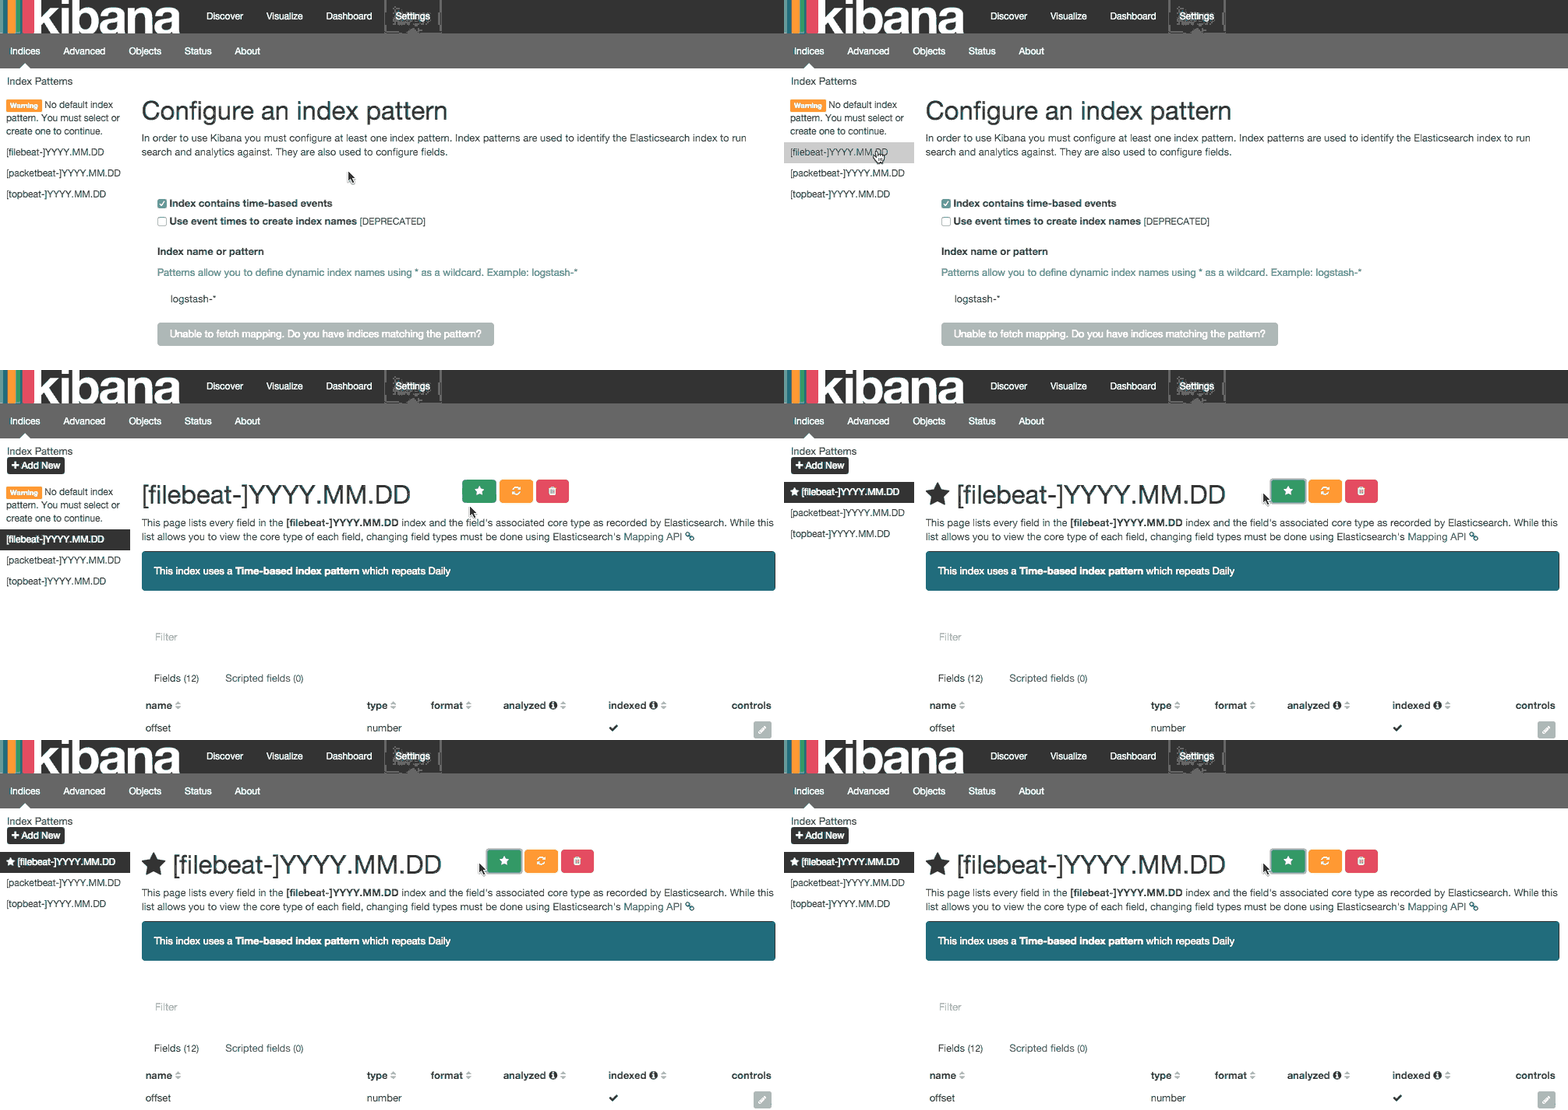
Go ahead and select [filebeat]-YYY.MM.DD from the Index Patterns menu (left side), then click the Star (Set as default index) button to set the Filebeat index as the default.
Now click the Discover link in the top navigation bar. By default, this will show you all of the log data over the last 15 minutes. You should see a histogram with log events, with log messages below:
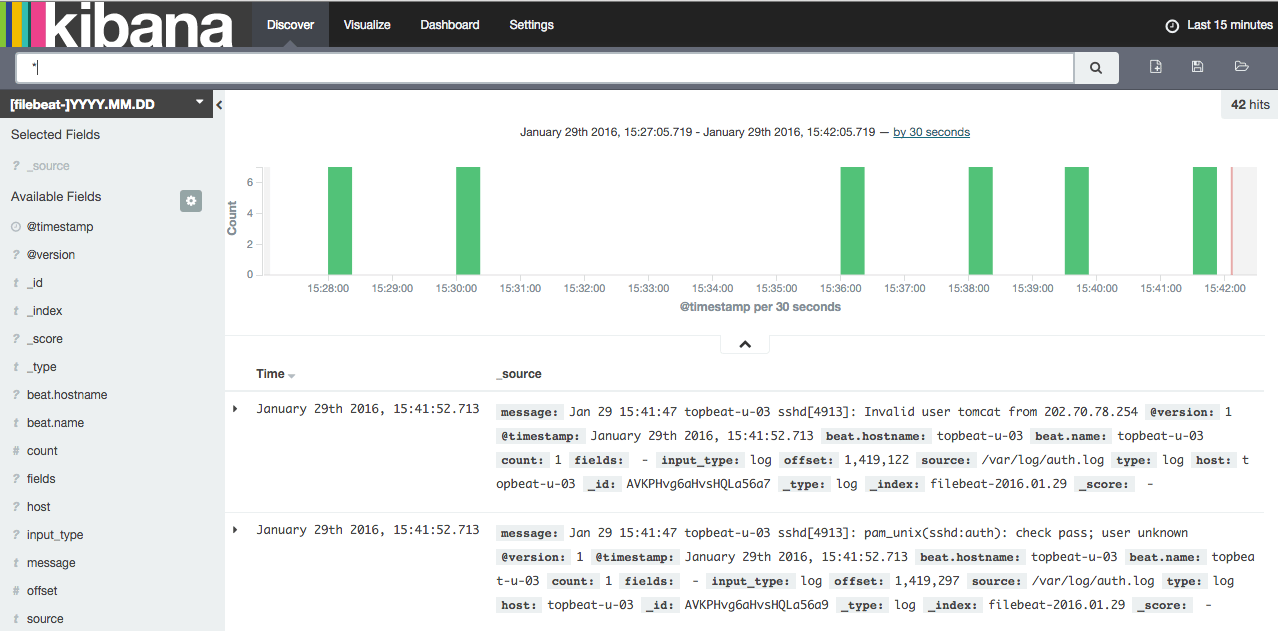
Right now, there won’t be much in there because you are only gathering syslogs from your client servers. Here, you can search and browse through your logs. You can also customize your dashboard.
Try the following things:
- Search for “root” to see if anyone is trying to log into your servers as root
- Search for a particular hostname (search for
host: "hostname") - Change the time frame by selecting an area on the histogram or from the menu above
- Click on messages below the histogram to see how the data is being filtered
Kibana has many other features, such as graphing and filtering, so feel free to poke around!
Conclusion
Now that your syslogs are centralized via Elasticsearch and Logstash, and you are able to visualize them with Kibana, you should be off to a good start with centralizing all of your important logs. Remember that you can send pretty much any type of log or indexed data to Logstash, but the data becomes even more useful if it is parsed and structured with grok.
To improve your new ELK stack, you should look into gathering and filtering your other logs with Logstash, and creating Kibana dashboards. You may also want to gather system metrics by using Topbeat with your ELK stack. All of these topics are covered in the other tutorials in this series.
Good luck!
Thanks for learning with the DigitalOcean Community. Check out our offerings for compute, storage, networking, and managed databases.
Tutorial Series: Centralized Logging with Logstash and Kibana On CentOS 7
Centralized logging can be very useful when attempting to identify problems with your servers or applications, as it allows you to search through all of your logs in a single place. It is also useful because it allows you to identify issues that span multiple servers by correlating their logs during a specific time frame. This series will teach you how to install Logstash and Kibana on Ubuntu, then how to add more filters to structure your log data. Then it will teach you how to use Kibana.
About the author

Software Engineer @ DigitalOcean. Former Señor Technical Writer (I no longer update articles or respond to comments). Expertise in areas including Ubuntu, PostgreSQL, MySQL, and more.
Still looking for an answer?
 This work is licensed under a Creative Commons Attribution-NonCommercial- ShareAlike 4.0 International License.
Become a contributor for community
Get paid to write technical tutorials and select a tech-focused charity to receive a matching donation.

DigitalOcean Documentation
Full documentation for every DigitalOcean product.

Resources for startups and AI-native businesses
The Wave has everything you need to know about building a business, from raising funding to marketing your product.
The developer cloud
Scale up as you grow — whether you're running one virtual machine or ten thousand.

Start building today
From GPU-powered inference and Kubernetes to managed databases and storage, get everything you need to build, scale, and deploy intelligent applications.