Introduction
Modern browsers have development tools built in to work with JavaScript and other web technologies. These tools include the Console which is similar to a shell interface, along with tools to inspect the DOM, debug, and analyze network activity.
The Console can be used to log information as part of the JavaScript development process, as well as allow you to interact with a web page by carrying out JavaScript expressions within the page’s context. Essentially, the Console provides you with the ability to write, manage, and monitor JavaScript on demand.
This tutorial will go over how to work with the Console and JavaScript within the context of a browser, and provide an overview of other built-in development tools you may use as part of your web development process.
Note: As you follow along in this tutorial, you may notice that your browser and the Console look different from the examples in the images. Browsers are frequently updated and often include new tools and possibly a new visual style. These updates should not affect your ability to use the Console in the browser.
Working with the Console in a Browser
Most modern web browsers that support standards-based HTML and XHTML will provide you with access to a Developer Console where you can work with JavaScript in an interface similar to a terminal shell. This section outlines how to access the Console in Firefox and Chrome.
Firefox
To open the Web Console in FireFox, navigate to the ☰ menu in the top right corner next to the address bar.
Select More Tools. With that open, click on the Web Developer Tools item.
Once you do so, a tray will open at the bottom of your browser window:
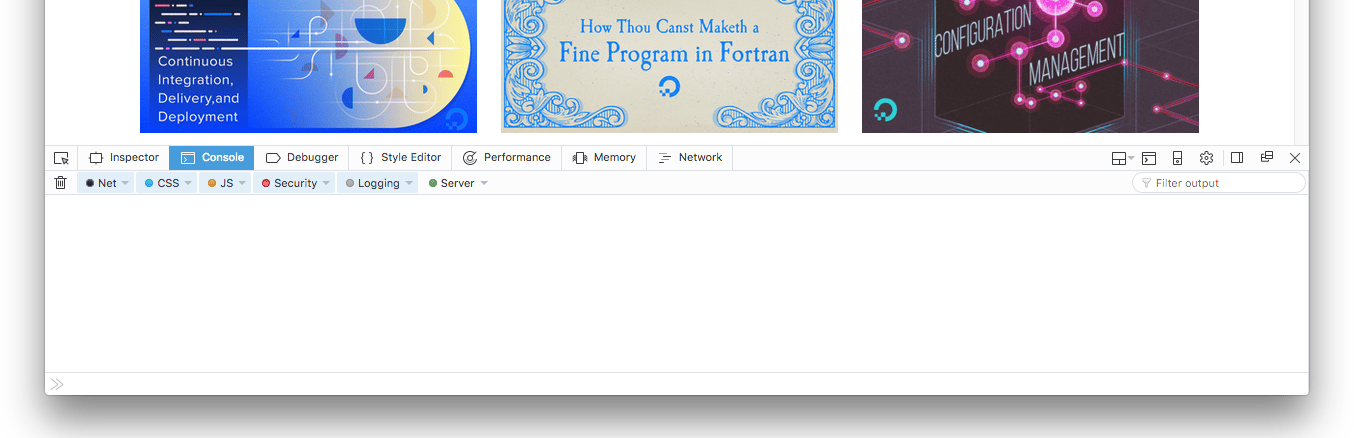
You can also enter into the Web Console with the keyboard shortcut CTRL + SHIFT + K on Linux and Windows, or COMMAND + OPTION + K on macOS.
Now that you have accessed the Console, you can begin working within it in JavaScript.
Chrome
To open the JavaScript Console in Chrome, you can navigate to the menu at the top-right of your browser window signified by three vertical dots. From there, you can select More Tools then Developer Tools.
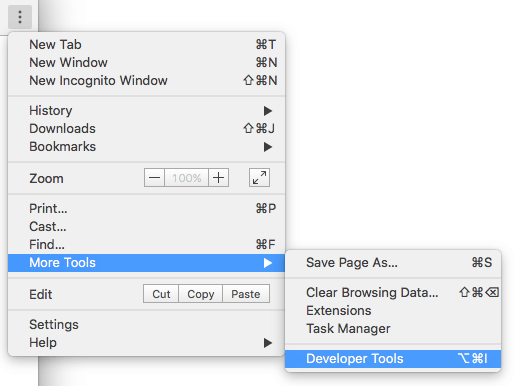
This will open a panel where you can click on Console along the top menu bar to bring up the JavaScript Console if it is not highlighted already:
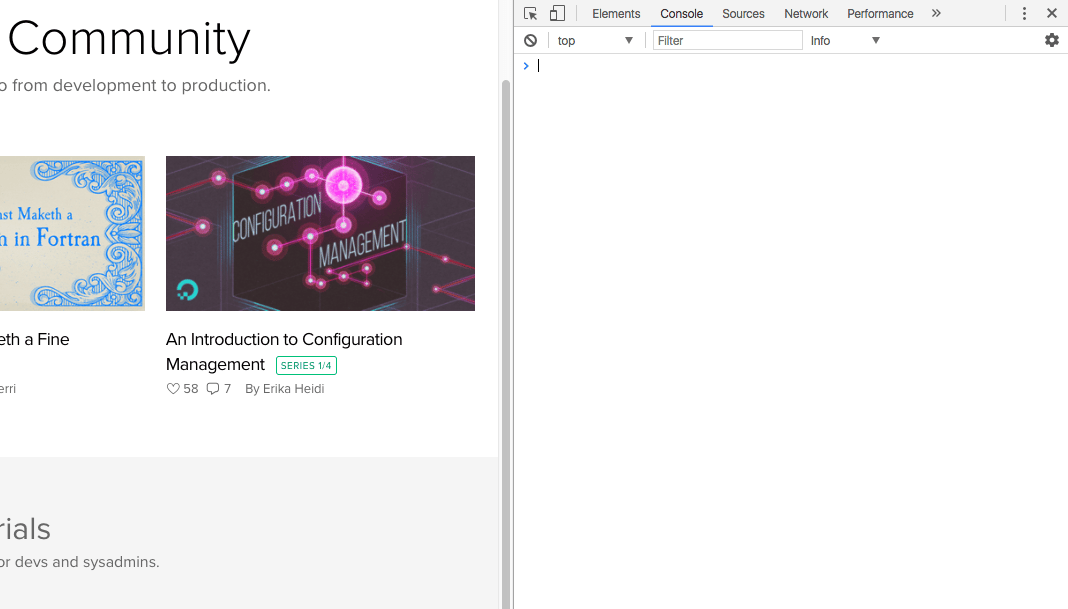
You can also enter into the JavaScript Console by using the keyboard shortcut CTRL + SHIFT + J on Linux or Windows, or COMMAND + OPTION + J on macOS, which will bring focus immediately to the Console.
Now that you have accessed the Console, you can begin working within it in JavaScript.
Working in the Console
Within the Console, you can type and execute JavaScript code.
Start with an alert that prints out the string Hello, World!:
- alert("Hello, World!");
Once you press the ENTER key following your line of JavaScript, an alert popup will appear in your browser:
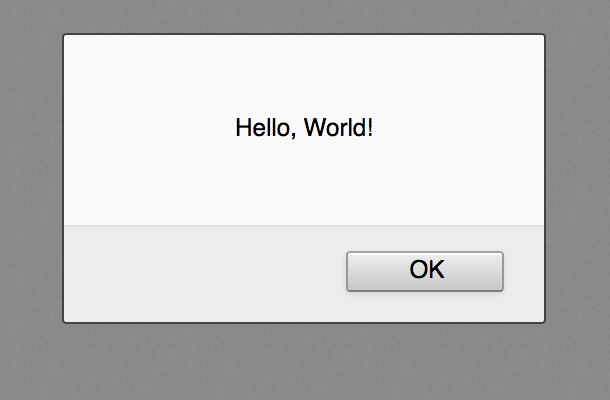
Note that the Console will also print the result of evaluating an expression, which will read as undefined when the expression does not explicitly return something.
Rather than have pop-up alerts that you need to click out of, you can work with JavaScript by logging it to the Console with console.log.
To print the Hello, World! string, type the following into the Console:
- console.log("Hello, World!");
Within the console, you’ll receive the following output:
OutputHello, World!
You can also perform math in the Console:
- console.log(2 + 6);
Output8
You can also try some more complicated math:
- console.log(34348.2342343403285953845 * 4310.23409128534);
Output148048930.17230788
Additionally, you can work on multiple lines with variables:
- let today = new Date();
- console.log("Today's date is " + today);
OutputToday's date is Wed May 18 2022 15:06:51 GMT-0500 (Central Daylight Time)
If you need to modify a command that you passed through the Console, you can type the up arrow (↑) key on your keyboard to retrieve the previous command. This will allow you to edit the command and send it again.
The JavaScript Console provides you with a space to try out JavaScript code in real time by letting you use an environment similar to a terminal shell interface.
Working with an HTML File
You can work within the context of an HTML file or a dynamically-rendered page in the Console. This provides you with the opportunity to experiment with JavaScript code within the context of existing HTML, CSS, and JavaScript.
Bear in mind that as soon as you reload a page after modifying it within the Console, it will return to its state prior to your modifying the document. Make sure to save any changes you would like to keep elsewhere.
Take an HTML document, such as the following index.html file, to understand how to use the Console to modify it. In your favorite text editor, create an index.html file and add the following lines of HTML:
<!DOCTYPE html>
<html lang="en-US">

<head>
    <meta charset="UTF-8">
    <meta name="viewport" content="width=device-width, initial-scale=1">
    <title>Today's Date</title>
</head>

<body>

</body>

</html>
If you save the above HTML file, and load it into the browser of your choice, a blank page with the title of Today's Date will be rendered in the browser.
Open up the Console and begin working with JavaScript to modify the page. Begin by using JavaScript to insert a heading into the HTML.
- let today = new Date();
- document.body.innerHTML = "<h1>Today's date is " + today + "</h1>"
You’ll receive the following output in the Console:
Output"<h1>Today's date is Wed May 18 2022 15:06:51 GMT-0500 (Central Daylight Time)</h1>"
Your page should be similar to the following:

You can modify the style of the page, such as the background color:
- document.body.style.backgroundColor = "lightblue";
Output"lightblue"
As well as the color of the text on the page:
- document.body.style.color = "white";
Output"white"
Now your page should reveal something similar this:

From here, you can create a <p> paragraph element:
- let p = document.createElement("P");
With this element created, you can then go on to create a text node that can be added to the paragraph:
- let t = document.createTextNode("Paragraph text.");
Add the text node by appending it to the variable p:
- p.appendChild(t);
And finally append p with its paragraph <p> element and appended text node to the document:
- document.body.appendChild(p);
Once you have completed these steps, your HTML page index.html will include the following elements:

The Console provides you with a space to experiment with modifying HTML pages, but it is important to keep in mind that you’re not changing the HTML document itself when you do things on the Console. Once you reload the page it will return to a blank document.
Understanding Other Development Tools
Depending on which browser’s development tools you use, you’ll be able to use other tools to help with your web development workflow.
DOM — Document Object Model
Each time a web page is loaded, the browser it is in creates a Document Object Model, or DOM, of the page.
The DOM is a tree of Objects and shows the HTML elements within a hierarchical view. The DOM Tree is available to view within the Inspector panel in Firefox or the Elements panel in Chrome.
These tools enable you to inspect and edit DOM elements and also let you identify the HTML related to an aspect of a particular page. The DOM can tell you whether a text snippet or image has an ID attribute and can help you determine what that attribute’s value is.
The page that you modified above would have a DOM view similar to this before reloading the page:
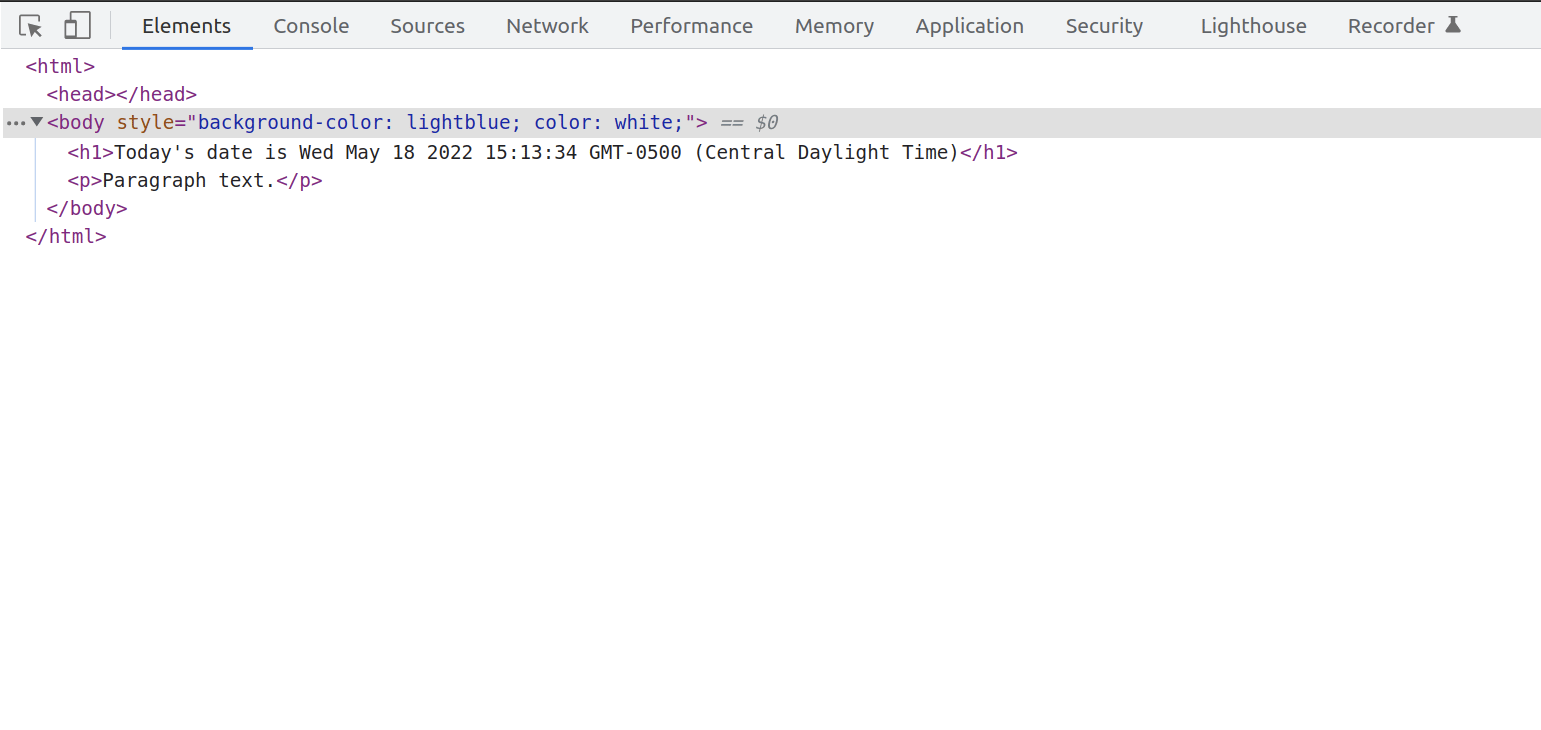
Additionally, you will see CSS styles in a side panel or below the DOM panel, allowing you to see what styles are being employed within the HTML document or via a CSS style sheet. For instance, notice what your sample page’s body style includes in the Firefox Inspector:
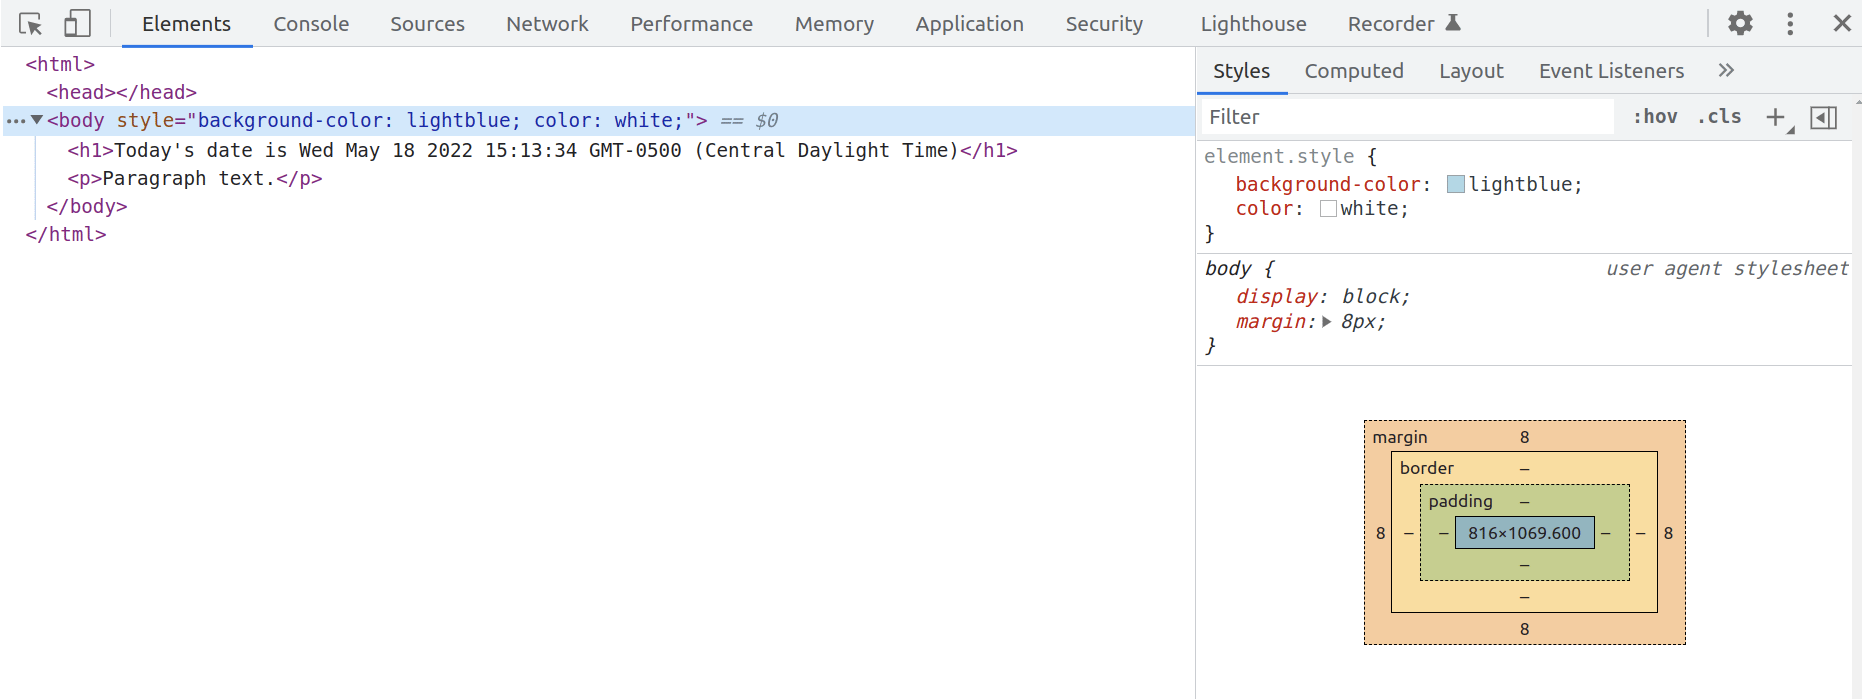
To live-edit a DOM node, double-click a selected element and make changes. For example, you can modify an <h1> tag and make it an <h2> tag.
As with the Console, if you reload the page you’ll return to the original saved state of the HTML document.
Network
The Network tab of your browser’s built-in development tools can monitor and record network requests. This tab reveals the network requests that the browser makes, including when it loads a page, how long each request takes, and provides the details of each of these requests. This can be used to optimize page load performance and debug request issues.
You can use the Network tab alongside the JavaScript Console. That is, you can start debugging a page with the Console then switch to the Network tab to see network activity without reloading the page.
To learn more about how to use the Network tab, you can read about working with Firefox’s Network Monitor or getting started with analyzing Network performance with Chrome’s DevTools.
Responsive Design
When websites are responsive, they are designed and developed to both look and function properly on a range of different devices: mobile phones, tablets, desktops, and laptops. Screen size, pixel density, and supporting touch are factors to consider when developing across devices. As a web developer, it is important to keep responsive design principles in mind so that your websites are fully available to people regardless of the device that they have access to.
Both Firefox and Chrome provide you with modes for ensuring that responsive design principles are given attention as you create and develop sites and apps for the web. These modes will emulate different devices that you can investigate and analyze as part of your development process.
Read more about Firefox’s Responsive Design Mode or Chrome’s Device Mode to learn more about how to leverage these tools to ensure more equitable access to web technologies.
Conclusion
This tutorial provided an overview of working with a JavaScript Console within modern web browsers, as well as some information on other development tools you can use in your workflow.
To learn more about JavaScript, you can read about data types, or the jQuery or D3 libraries.
Thanks for learning with the DigitalOcean Community. Check out our offerings for compute, storage, networking, and managed databases.
Tutorial Series: How To Code in JavaScript
JavaScript is a high-level, object-based, dynamic scripting language popular as a tool for making webpages interactive.
Browse Series: 37 tutorials
About the author

Community and Developer Education expert. Former Senior Manager, Community at DigitalOcean. Focused on topics including Ubuntu 22.04, Ubuntu 20.04, Python, Django, and more.
Still looking for an answer?
 This work is licensed under a Creative Commons Attribution-NonCommercial- ShareAlike 4.0 International License.
Become a contributor for community
Get paid to write technical tutorials and select a tech-focused charity to receive a matching donation.

DigitalOcean Documentation
Full documentation for every DigitalOcean product.

Resources for startups and AI-native businesses
The Wave has everything you need to know about building a business, from raising funding to marketing your product.
The developer cloud
Scale up as you grow — whether you're running one virtual machine or ten thousand.

Start building today
From GPU-powered inference and Kubernetes to managed databases and storage, get everything you need to build, scale, and deploy intelligent applications.