
Introduction
Collecting and visualizing data is an important way to make informed decisions about your servers and projects.
In a previous guide, we discussed how to install and configure Graphite to visualize data on our servers. However, we didn’t have a good way of collecting or even passing data into Graphite.
In this guide, we’ll discuss the installation and use of collectd, a system statistics gatherer that can collect and organize metrics about your server and running services.
We will show you how to install and configure collectd to pass data into Graphite to render. We will assume that you have Graphite up and running on an Ubuntu 14.04 server as we showed you in the last guide.
Install Collectd
The first thing we are going to do is install collectd. We can get this from the default repositories.
Refresh the local package index and then install by typing:
sudo apt-get update
sudo apt-get install collectd collectd-utils
This will install the daemon and a helper control interface. We still need to configure it so that it knows to pass the data it collects to Graphite.
Configure Collectd
Begin by opening the collectd configuration file in your editor with root privileges:
sudo nano /etc/collectd/collectd.conf
The first thing that we should set is the hostname of the machine that we are on. Collectd can be used to send information to a remote Graphite server, but we are using this on the same machine for this guide. You can choose whatever name you’d like:
<pre> Hostname “<span class=“highlight”>graph_host</span>” </pre>
If you have a real domain name configured, you can skip this and just leave toe FQDNLookup so that the server will use the DNS system to get the proper domain.
You may notice there is a parameter for “Interval”, which is the interval that collectd waits before querying data on the host. This is set by default to 10 seconds. If you followed along in the Graphite article, you will notice that this is the usual shortest interval for Graphite to track stats. These two values must match for data to be recorded reliably.
Next, we get right into the services that Collectd will gather information about. Collectd does this through the use of plugins. Most of the plugins are used to read information from the system, but plugins are also used to define where to send information. Graphite is one of these write plugins.
For this guide, we are going to ensure that the following plugins are enabled. You can comment out any other plugins, or you can work on configuring them correctly if you want to try them out on your host:
LoadPlugin apache
LoadPlugin cpu
LoadPlugin df
LoadPlugin entropy
LoadPlugin interface
LoadPlugin load
LoadPlugin memory
LoadPlugin processes
LoadPlugin rrdtool
LoadPlugin users
LoadPlugin write_graphite
Some of these need configuration, and some of them will work fine out-of-the-box.
Continuing on down the file, we get to the configuration section of each plugin. Plugins are configured by defining a “block” for each configuration section. This is somewhat similar to how Apache compartmentalizes directives within blocks. We only will be taking a look at a few of these, since most of our plugins will work fine the way they are.
We enabled the Apache plugin because we have Apache installed to serve Graphite. We can configure the Apache plugin with a simple section that looks like this:
<pre> <Plugin apache> <Instance “Graphite”> URL “http://<span class=“highlight”>domain_name_or_IP</span>/server-status?auto” Server “apache” </Instance> </Plugin> </pre>
In a production environment, you may wish to keep the server stats protected behind an authentication layer. You can look at the commented code in this section of the file to see how that would work. For simplicity’s sake, we are going to demonstrate an open setup that is not authenticated.
We will be creating the server-status page for Apache that provides us with the details we need in a bit.
For the df plugin, which tells us how full our disks are, we can add a simple configuration that looks like this:
<pre> <Plugin df> Device “/dev/<span class=“highlight”>vda</span>” MountPoint “/” FSType “ext3” </Plugin> </pre>
You should point the device to the device name of the drive on your system. You can find this by typing the command in the terminal:
<pre> df </pre> <pre> Filesystem 1K-blocks Used Available Use% Mounted on <span class=“highlight”>/dev/vda</span> 61796348 1766820 56867416 4% / none 4 0 4 0% /sys/fs/cgroup udev 2013364 12 2013352 1% /dev tmpfs 404836 340 404496 1% /run none 5120 0 5120 0% /run/lock none 2024168 0 2024168 0% /run/shm none 102400 0 102400 0% /run/user </pre>
Choose the networking interface you wish to monitor:
<pre> <Plugin interface> Interface “<span class=“highlight”>eth0</span>” IgnoreSelected false </Plugin> </pre>
Finally, we come to the Graphite plugin. This will tell collectd how to connect to our Graphite instance. Make the section look something like this:
<pre> <Plugin write_graphite> <Node “<span class=“highlight”>graphing</span>”> Host “localhost” Port “2003” Protocol “tcp” LogSendErrors true Prefix “collectd.” StoreRates true AlwaysAppendDS false EscapeCharacter “_” </Node> </Plugin> </pre>
This tells our daemon how to connect to Carbon in order to pass off its data. We specify that it should look to the local computer on port 2003, which Carbon uses to listen for TCP connections.
Next, we tell it to use that protocol to reliably hand off the data to Carbon. We tell it to log errors about the hand off and then set the prefix for the data. Since we end this value with a dot, all of the collectd stats for this host will be stored in a “collectd” directory.
The store rates determines whether stats will be converted to gauges before being passed. The append data source line would append the node name to our metrics if enabled. The escape character determines how certain values with dots in them are converted to avoid Carbon from splitting them into directories.
Save and close the file when you are finished.
Configure Apache to Report Stats
In our configuration file, we enabled Apache stats tracking. We still need to configure Apache to allow this though.
In the Apache virtual hosts file that we have enabled for Graphite, we can add a simple location block that will tell Apache to report stats.
Open the file in your text editor:
sudo nano /etc/apache2/sites-available/apache2-graphite.conf
Below the “content” location block, we are going to add another block so that Apache will serve statistics at the /server-status page. Add the following section:
<pre> Alias /content/ /usr/share/graphite-web/static/ <Location “/content/”> SetHandler None </Location>
<span class="highlight"><Location "/server-status"></span>
<span class="highlight">SetHandler server-status</span>
<span class="highlight">Require all granted</span>
<span class="highlight"></Location></span>
ErrorLog ${APACHE_LOG_DIR}/graphite-web_error.log
</pre>
Save and close the file when you are finished.
Now, we can reload Apache to get access to the new statistics:
sudo service apache2 reload
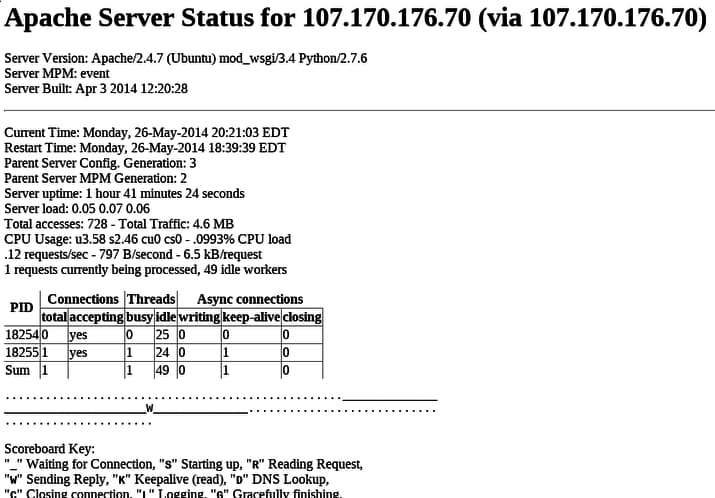
We can check to make sure everything is working correctly by visiting the page in our web browser. We just need to go to our domain, followed by /server-status:
<pre> http://<span class=“highlight”>domain_name_or_IP</span>/server-status </pre>
You should see a page that looks something like this:
Setting the Storage Schema and Aggregation
Now that we have collectd configured to gather statistics about your services, we need to adjust Graphite to handle the data it receives correctly.
Let’s start by creating a storage schema definition. Open up the storage schema configuration file:
sudo nano /etc/carbon/storage-schemas.conf
Inside, we need to add a definition that will dictate how long the information is kept, and how detailed the data should be at various levels.
We will tell Graphite to store collectd information at intervals of ten seconds for one day, at one minute for seven days, and intervals of ten minutes for one year.
This will give us a good balance between detailed information for recent activity and general trends over the long term. Collectd passes its metrics starting with the string collectd, so we will match that pattern.
The policy we described can be added by adding these lines. Remember, add these above the default policy, or else they will never be applied:
[collectd]
pattern = ^collectd.*
retentions = 10s:1d,1m:7d,10m:1y
Save and close the file when you are finished.
Reload the Services
Now that collectd is configured and Graphite knows how to handle its data, we can reload the services.
First, restart the Carbon service. It is a good idea to use the “stop” and then “start” command with a few seconds in between instead of the “restart” command. This makes sure that the data is completely flushed prior to the restart:
sudo service carbon-cache stop          ## wait a few seconds here
sudo service carbon-cache start
After the Carbon service is up and running again, we can do the same thing with collectd. The service may not be running yet, but this will ensure that it handles the data correctly:
sudo service collectd stop
sudo service collectd start
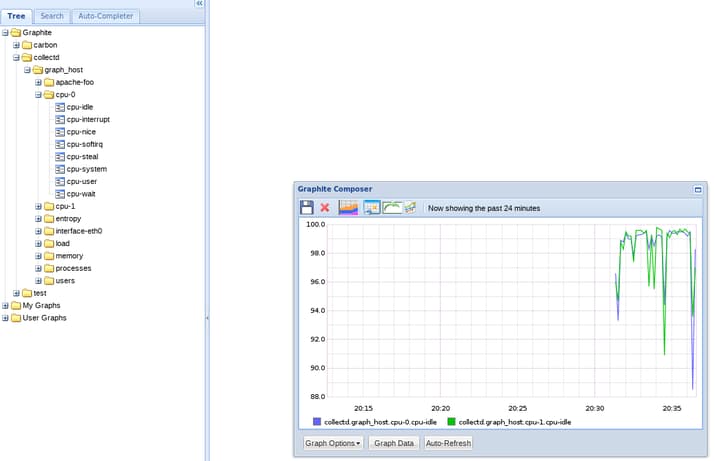
After this, you can visit your domain again, and you should see a new tree with your collectd information:
Conclusion
Our collectd configuration is complete and our stats are already being recorded! Now, we have a daemon configured to track our server and services.
We can configure or write additional plugins for collectd as the need arises. Additional servers with collectd can also send data to our Graphite server. Collectd is mainly used for collecting statistics about common services and your machines as a whole.
In the next article, we’ll set up StatsD, a service that can cache data before flushing it to Graphite. This will allow us us to work around the problem of data loss when sending stats too quickly that we described in the previous article. It will also give us with an interface to track statistics within our own programs and projects.
<div class=“author”>By Justin Ellingwood</div>
Thanks for learning with the DigitalOcean Community. Check out our offerings for compute, storage, networking, and managed databases.
Tutorial Series: Introduction to Tracking Statistics on Servers
Collecting and analyzing statistics on your servers and infrastructure becomes increasingly valuable as the complexity of your systems increase. In this series, we will introduce you to some battle-tested statistics gathering and rendering tools. We will go over some basic concepts and then show you how to install and set up each component to effectively monitor your servers and processes.
About the author

Former Senior Technical Writer at DigitalOcean, specializing in DevOps topics across multiple Linux distributions, including Ubuntu 18.04, 20.04, 22.04, as well as Debian 10 and 11.
Still looking for an answer?
 This work is licensed under a Creative Commons Attribution-NonCommercial- ShareAlike 4.0 International License.
Become a contributor for community
Get paid to write technical tutorials and select a tech-focused charity to receive a matching donation.

DigitalOcean Documentation
Full documentation for every DigitalOcean product.

Resources for startups and AI-native businesses
The Wave has everything you need to know about building a business, from raising funding to marketing your product.
The developer cloud
Scale up as you grow — whether you're running one virtual machine or ten thousand.

Start building today
From GPU-powered inference and Kubernetes to managed databases and storage, get everything you need to build, scale, and deploy intelligent applications.