
Introduction
There are plenty of reasons why collecting stats about your servers, applications, and traffic is a good idea. Collecting and organizing data can give you confidence in your decisions about scaling, troubleshooting, and tracking down pain-points in your configurations.
There are a variety of tools that can be used to track metrics on our machines, and they are often delegated to a certain small portion of the process. We can hook these tools together to create a system for gathering, recording, and displaying the results.
In this guide, we are going to discuss some technologies that will allow you to collect, store, and visualize the data generated by your servers and applications.
We will discuss Graphite, a graphing library made up of several components that can be used to render visual representations of your data over time. We will also look into collectd, a system statistics daemon that can collect near-realtime information about a running server. Last on our list will be StatsD, a flexible statistics aggregator that can be used to collect and organize arbitrary data.
In a later guide, we will go over how to install and configure these components on an Ubuntu 14.04 server to get you up and running.
Why Do We Track Data?
The first thing that we need to establish are the reasons that we track data in a server or application environment.
The overarching reason is actually quite simple: the more data we have, the more likely we will be able to understand what is happening at any given moment. This gives us the remarkable ability to back up our decisions with hard data and to see ahead of time whether a change is likely targeted at the correct component. Tracking stats provides us with a supplementary source of information that might not be present in the application logs.
Most (but not all) logging systems are unable to correlate data from various applications or to connect events to certain system states because they basically represent self-contained application output. This can make it tricky to build a holistic view of the circumstances surrounding an event.
We can imagine for a moment that you have an incident where your database server goes down. While reading through the logs, you may notice that at 15:35:28 UTC, your MySQL service was killed with an OOM (out of memory) error. We now know that the memory usage was the issue, but we may not have any idea what caused the memory-usage spike in a formerly stable server.
If we were tracking data about our server and our applications, we could begin to bring together apparently disparate pieces of system data to help us understand what the environment looked like exactly at the time of the problem. We may find that we had a steady climb in memory usage that can come from a memory leak. If we have information about application-level memory usage, we can likely see exactly which program is the culprit. We might also see that there was an unusual spike, which could mean something entirely different.
In a different scenario, we can see what the system looks like before and after a deploy. If new code creates some strange conditions, we can see the affect it has on our other components, and compare its performance with our old code. We can identify points where our new code is showing an improvement, and places where we may have made a mistake.
With smart data collection, we can see our system as a system, instead of as a loose set of unrelated components.
Graphite Components
We are going to start a bit backwards here and talk about Graphite, the graphing library, first. We will then go back and cover some of the software that Graphite can use to get data.
Graphite is a graphing library responsible for storing and rendering visual representations of data. This means that Graphite requires other applications to collect and transfer the data points.
The Graphite project itself is composed of a few different components, each of which has a specific, focused purpose.
The Graphite Web App
The most visible and dynamic component of a Graphite installation is the Graphite web application.
This is where you can design graphs that plot your data:
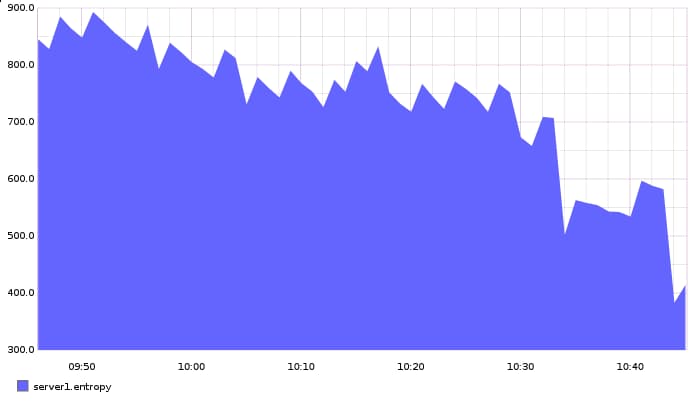
Graphite gives you a very flexible interface to design graphs. You can combine different types of metrics, control labeling, fonts, colors, and line properties, and you can resize and manipulate the data at will.
The key idea to digest here is that Graphite renders graphs based on the data points it receives and the directions you give it. It doesn’t just print out graph and then throw away the data. You can render the data in whatever data you want, on the fly.
The web application also lets you save graph properties and layouts, so that you can pull up your monitoring interface with all of the settings you would like. You can have as many dashboard views as you would like, meaning that you can have a separate dashboard for each machine or application. If you need to correlate the data across these, just drag-and-drop the graphs to combine the display.
The flexibility does not end there though. Graphite allows you to render graphs at a bare URL for embedding into other interfaces. You can also export the data in non-graphical representations like JSON or CSV, or output an SVG with embedded data information.
Now that you know about what you can do with the data when you get it, let’s talk about the other Graphite components to see the processes that allow us to do this.
Carbon
Carbon is the storage backend for a Graphite configuration. A single Graphite configuration will have one or more Carbon daemons that are responsible for handling data that is sent over by other processes that collect and transmit statistics (the collectors are not part of Graphite).
There are a variety of different Carbon daemons, each of which handle data in a different way. The most basic of these is called carbon-cache.py. This daemon is straight-forward. It listens for data on a port and writes that data to disk as it arrives, in an efficient way.
It stores data as it comes and then flushes it to disk after a predetermined period of time. It is important to recognize that the Carbon component handles the data receiving and flushing procedures. It does not handle the actual storage mechanisms. That is left to the whisper component that we will talk about momentarily.
The carbon-cache.py daemon is told what formats, protocols, and ports to work on. It also is told what data retention policies to use for data storage. These are given over to whisper. For most basic configurations, a single carbon-cache.py instance is sufficient to handle the data reception.
Multiple instances can be run at once as your setup grows. These can be balanced by a carbon-relay.py or carbon-aggregator.py daemon in front.
The carbon-relay.py daemon can be used to send requests to all backend daemons for some redundancy. It can also be used to shard data across different carbon-cache.py instances to spread out read loads across multiple storage locations.
The carbon-aggregator.py daemon can buffer data and then dump it into carbon-cache.py after a time. This can help lessen the impact of your stats processing on the system at the expense of detail.
Whisper
Whisper is a database library that Graphite uses to store the information that it is sent.
It is very flexible and allows time-series data to be stored in great detail. It creates different archives at different levels of detail, so that in practical usage, the information gracefully degraded into lower resolutions when it passes certain configured aging thresholds.
For instance, you could store one data-point per second for a certain metric. You can tell whisper this detailed data should be kept for 5 hours. You might also have an archive that stores lower resolution data. It might only stores one point per minute and keep it for a period of 6 months.
Each point in a lower-resolution archive is calculated from the same data that is recorded in the higher resolution archives. You can have as many archives of different resolutions and retention rates as you wish. You can configure how whisper calculates the data for lower-resolution archives depending on the type of metric being tracked.
For instance, a metric might be a tally of the number of times some event occurs over a short time frame. To create a point for a larger time frame at a lower resolution, you would add up the data points of the higher resolution archive to summarize the data values over the larger span of time.
Whisper can calculate lower-resolution data in other ways depending on the nature of the metrics. For instance, some data is generalized by averaging, while others might be tracking a maximum value. For the average, an actual mean value is calculated from the higher resolution points to create the lower resolution point. For the maximum, the highest value should be kept and the rest should be thrown away to maintain the meaning of the number.
Whisper calculates and records the lower resolution data at the time that it receives the data (after the amount of time needed to collect the necessary values). It simply collects the data points it needs to perform the data aggregation technique (average, max, etc) and then writes it.
Graphite will use the highest-resolution archive that contains the requested time-frame when it queries for data to render graphs.
Stats Gathering and Delivery
As we mentioned above, Graphite itself does not concern itself with data collection. Instead, it relies on being fed information from other services. This allows the project to maintain a narrow focus and allows it to modularly interact with a variety of input services.
Below, we will discuss the protocols that Graphite understands, and then discuss two popular collection programs, collectd and StatsD, that can be used to pass data to Carbon for processing.
Protocols
There are three different protocols that you can use to send data to Graphite.
First, Graphite accepts and can understand plain text. This is the most flexible format because almost any application or service can produce text output and this can be used to feed Graphite or an intermediate tool.
The plain text messages include information about the metric name, the value being given, and a timestamp for that value. These messages can be sent straight to Carbon on a port designated for plain text, with no additional formatting.
Because Graphite is created in Python, Graphite also accepts the “pickle” data serialization format. This Python standard allows you to buffer and send multiple time values in a single transaction.
Graphite can also accept data using AMQP messages. This lets you handle large loads of data more gracefully. You can feed in a great number of stats and handle interruptions in network connections between remote hosts without losing data with this configuration.
Collectd
One of the easiest ways to collect detailed information about a server is with a daemon called collectd.
Collectd can gather statistics about many different components of a server environment. It allows you to easily track common metrics like memory usage, CPU load, network traffic etc. This allows you to easily correlate events with the state of your systems.
Beyond collecting standard system information, collectd also has a plugin system that extends its functionality. This means that you can easily track common software like Apache, Nginx, iptables, memcache, MySQL, PostgreSQL, OpenVPN, and many more.
Collectd provides a simple way to get data from pre-build applications and common services on your servers. This should be used to track the behavior of your infrastructure and the services you rely on.
StatsD
StatsD is a very simple daemon that can be used to send other data to Graphite. The benefit of this approach is that it becomes trivial to build in stat tracking to applications and systems that you are creating.
StatsD operates by listening on an interface for simple UDP packets that represent a single data point. This means that it it can accept a vast amount of information in a connectionless way. It can then aggregate the values that it receives and pass them on to Graphite.
This system allows you to send stats in large quantities without worrying about increasing application latency. The StatsD service will collect all data as it comes, aggregate it, and then send nice, summarized data points to Graphite in the time frame it expects.
Because of these advantages, it is actually a good intermediary for any kind of data sent to Graphite. But the main way that we can leverage this is for monitoring our own applications and tools that we create.
StatsD is perfect for this because it is a general purpose daemon that accepts UDP traffic. There are many different client-side libraries in various programming languages that can send data directly to a StatsD instance. This means that the applications you are building can easily send data to be tracked.
Conclusion
By now, you should have a fairly good understanding of how a collection of different statistics and graphing utilities can work together to give you a complete picture of your environment.
In the next guide, we’ll discuss how to install Graphite on an Ubuntu 14.04 server. Afterwards, we’ll hook up collectd and StatsD to Graphite to feed in stats to monitor.
<div class=“author”>By Justin Ellingwood</div>
Thanks for learning with the DigitalOcean Community. Check out our offerings for compute, storage, networking, and managed databases.
Tutorial Series: Introduction to Tracking Statistics on Servers
Collecting and analyzing statistics on your servers and infrastructure becomes increasingly valuable as the complexity of your systems increase. In this series, we will introduce you to some battle-tested statistics gathering and rendering tools. We will go over some basic concepts and then show you how to install and set up each component to effectively monitor your servers and processes.
About the author

Former Senior Technical Writer at DigitalOcean, specializing in DevOps topics across multiple Linux distributions, including Ubuntu 18.04, 20.04, 22.04, as well as Debian 10 and 11.
Still looking for an answer?
 This work is licensed under a Creative Commons Attribution-NonCommercial- ShareAlike 4.0 International License.
Become a contributor for community
Get paid to write technical tutorials and select a tech-focused charity to receive a matching donation.

DigitalOcean Documentation
Full documentation for every DigitalOcean product.
Resources for startups and AI-native businesses
The Wave has everything you need to know about building a business, from raising funding to marketing your product.
The developer cloud
Scale up as you grow — whether you're running one virtual machine or ten thousand.

Start building today
From GPU-powered inference and Kubernetes to managed databases and storage, get everything you need to build, scale, and deploy intelligent applications.